Data
83,911 items of data are available, covering 79,384 participants.
Defined-instances run from 2 to 3, labelled using Instancing
2.
Units of measurement are AU.
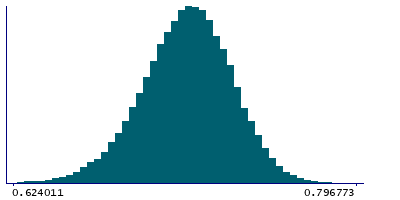
| Maximum | 0.806028 |
| Decile 9 | 0.738065 |
| Decile 8 | 0.729168 |
| Decile 7 | 0.722439 |
| Decile 6 | 0.716667 |
| Median | 0.711124 |
| Decile 4 | 0.705505 |
| Decile 3 | 0.699281 |
| Decile 2 | 0.691771 |
| Decile 1 | 0.680897 |
| Minimum | 0 |
|
|
- Mean = 0.710022
- Std.dev = 0.0235217
- 111 items below graph minimum of 0.623729
- 4 items above graph maximum of 0.795233
|
2 Instances
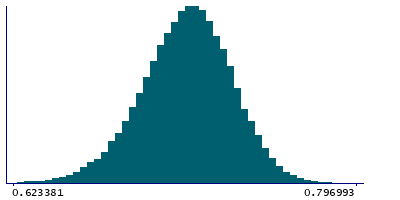
Instance 2 : Imaging visit (2014+)
79,153 participants, 79,153 items
| Maximum | 0.806028 |
| Decile 9 | 0.737943 |
| Decile 8 | 0.729027 |
| Decile 7 | 0.72227 |
| Decile 6 | 0.71647 |
| Median | 0.710955 |
| Decile 4 | 0.705313 |
| Decile 3 | 0.699044 |
| Decile 2 | 0.691502 |
| Decile 1 | 0.680648 |
| Minimum | 0 |
|
|
- Mean = 0.709817
- Std.dev = 0.0236269
- 108 items below graph minimum of 0.623354
- 3 items above graph maximum of 0.795238
|
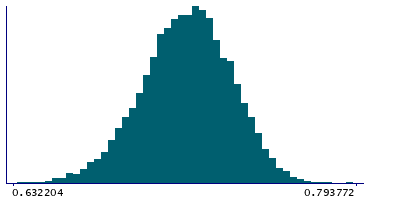
Instance 3 : First repeat imaging visit (2019+)
4,758 participants, 4,758 items
| Maximum | 0.801805 |
| Decile 9 | 0.739907 |
| Decile 8 | 0.73159 |
| Decile 7 | 0.725152 |
| Decile 6 | 0.71959 |
| Median | 0.714332 |
| Decile 4 | 0.708956 |
| Decile 3 | 0.703108 |
| Decile 2 | 0.696322 |
| Decile 1 | 0.686005 |
| Minimum | 0.550952 |
|
|
- Mean = 0.713431
- Std.dev = 0.021411
- 8 items below graph minimum of 0.632103
- 1 item above graph maximum of 0.793809
|
Notes
Mean FA (fractional anisotropy) in cerebral peduncle (left) on FA skeleton (from dMRI data)
0 Related Data-Fields
There are no related data-fields
2 Applications
| Application ID | Title |
|---|
| 17689 | Genetic, environmental and lifestyle predictors of brain/cognitive-related outcomes. |
| 22783 | The joint analysis of imaging data and genetic data for early tumor detection, prevention, diagnosis and treatment |

