Data
83,911 items of data are available, covering 79,384 participants.
Defined-instances run from 2 to 3, labelled using Instancing
2.
Units of measurement are AU.
| Maximum | 0.001018 |
| Decile 9 | 0.000414 |
| Decile 8 | 0.000395 |
| Decile 7 | 0.000382 |
| Decile 6 | 0.000372 |
| Median | 0.000364 |
| Decile 4 | 0.000356 |
| Decile 3 | 0.000348 |
| Decile 2 | 0.000339 |
| Decile 1 | 0.000327 |
| Minimum | -1.5e-05 |
|

|
- Mean = 0.000368554
- Std.dev = 3.8421e-05
- 2 items below graph minimum of 0.00024
- 620 items above graph maximum of 0.000501
|
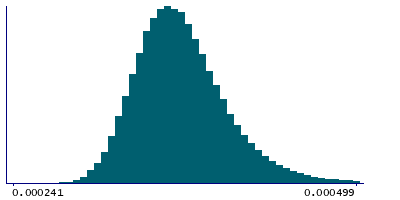
2 Instances
Instance 2 : Imaging visit (2014+)
79,153 participants, 79,153 items
| Maximum | 0.001018 |
| Decile 9 | 0.000415 |
| Decile 8 | 0.000395 |
| Decile 7 | 0.000382 |
| Decile 6 | 0.000372 |
| Median | 0.000364 |
| Decile 4 | 0.000356 |
| Decile 3 | 0.000348 |
| Decile 2 | 0.000339 |
| Decile 1 | 0.000327 |
| Minimum | 0.000117 |
|
|
- Mean = 0.000368804
- Std.dev = 3.86052e-05
- 1 item below graph minimum of 0.000239
- 565 items above graph maximum of 0.000503
|
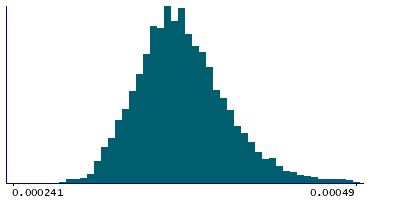
Instance 3 : First repeat imaging visit (2019+)
4,758 participants, 4,758 items
| Maximum | 0.000608 |
| Decile 9 | 0.000407 |
| Decile 8 | 0.0003895 |
| Decile 7 | 0.000378 |
| Decile 6 | 0.000369 |
| Median | 0.000361 |
| Decile 4 | 0.000353 |
| Decile 3 | 0.000345 |
| Decile 2 | 0.000337 |
| Decile 1 | 0.000324 |
| Minimum | -1.5e-05 |
|
|
- Mean = 0.000364391
- Std.dev = 3.49546e-05
- 1 item below graph minimum of 0.000241
- 23 items above graph maximum of 0.00049
|
Notes
Mean L3 in superior longitudinal fasciculus (left) on FA (fractional anisotropy) skeleton (from dMRI data)
0 Related Data-Fields
There are no related data-fields
2 Applications
| Application ID | Title |
|---|
| 17689 | Genetic, environmental and lifestyle predictors of brain/cognitive-related outcomes. |
| 22783 | The joint analysis of imaging data and genetic data for early tumor detection, prevention, diagnosis and treatment |

