Data
346,325 items of data are available, covering 272,586 participants.
Some values have special meanings defined by Data-Coding
100291.
Defined-instances run from 0 to 3, labelled using Instancing
2.
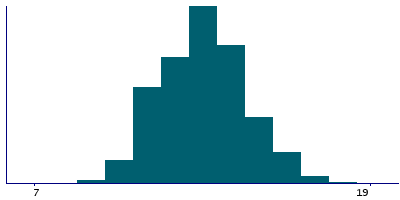
Units of measurement are years.
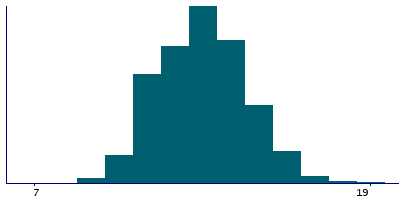
| Maximum | 25 |
| Decile 9 | 15 |
| Decile 8 | 14 |
| Decile 7 | 14 |
| Decile 6 | 13 |
| Median | 13 |
| Decile 4 | 13 |
| Decile 3 | 12 |
| Decile 2 | 12 |
| Decile 1 | 11 |
| Minimum | 5 |
|
|
- There are 21 distinct values.
- Mean = 12.9755
- Std.dev = 1.61776
- 44 items below graph minimum of 7
- 205 items above graph maximum of 19
- 649 items have value -3 (Prefer not to answer)
- 9973 items have value -1 (Do not know)
|
4 Instances
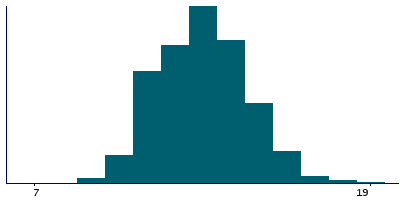
Instance 0 : Initial assessment visit (2006-2010) at which participants were recruited and consent given
272,561 participants, 272,561 items
| Maximum | 25 |
| Decile 9 | 15 |
| Decile 8 | 14 |
| Decile 7 | 14 |
| Decile 6 | 13 |
| Median | 13 |
| Decile 4 | 13 |
| Decile 3 | 12 |
| Decile 2 | 11 |
| Decile 1 | 11 |
| Minimum | 5 |
|
|
- There are 21 distinct values.
- Mean = 12.9699
- Std.dev = 1.6232
- 37 items below graph minimum of 7
- 153 items above graph maximum of 19
- 536 items have value -3 (Prefer not to answer)
- 7832 items have value -1 (Do not know)
|
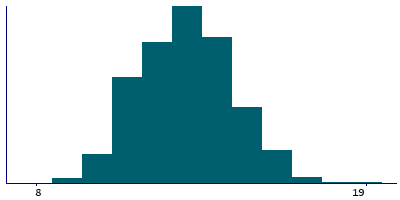
Instance 1 : First repeat assessment visit (2012-13)
10,394 participants, 10,394 items
| Maximum | 25 |
| Decile 9 | 15 |
| Decile 8 | 14 |
| Decile 7 | 14 |
| Decile 6 | 13 |
| Median | 13 |
| Decile 4 | 13 |
| Decile 3 | 12 |
| Decile 2 | 12 |
| Decile 1 | 11 |
| Minimum | 8 |
|
|
- There are 15 distinct values.
- Mean = 12.9685
- Std.dev = 1.59982
- 7 items above graph maximum of 19
- 16 items have value -3 (Prefer not to answer)
- 282 items have value -1 (Do not know)
|
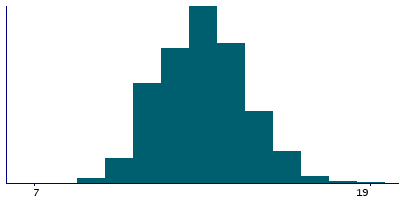
Instance 2 : Imaging visit (2014+)
52,700 participants, 52,700 items
| Maximum | 25 |
| Decile 9 | 15 |
| Decile 8 | 14 |
| Decile 7 | 14 |
| Decile 6 | 13 |
| Median | 13 |
| Decile 4 | 13 |
| Decile 3 | 12 |
| Decile 2 | 12 |
| Decile 1 | 11 |
| Minimum | 5 |
|
|
- There are 20 distinct values.
- Mean = 12.9976
- Std.dev = 1.59675
- 4 items below graph minimum of 7
- 37 items above graph maximum of 19
- 92 items have value -3 (Prefer not to answer)
- 1571 items have value -1 (Do not know)
|
Instance 3 : First repeat imaging visit (2019+)
10,670 participants, 10,670 items
| Maximum | 25 |
| Decile 9 | 15 |
| Decile 8 | 14 |
| Decile 7 | 14 |
| Decile 6 | 13 |
| Median | 13 |
| Decile 4 | 13 |
| Decile 3 | 12 |
| Decile 2 | 12 |
| Decile 1 | 11 |
| Minimum | 5 |
|
|
- There are 18 distinct values.
- Mean = 13.0167
- Std.dev = 1.59738
- 3 items below graph minimum of 7
- 8 items above graph maximum of 19
- 5 items have value -3 (Prefer not to answer)
- 288 items have value -1 (Do not know)
|
Notes
ACE touchscreen question "How old were you when your periods started?"
The following checks were performed:
- If answer < 5 then rejected
- If answer > Participants age then rejected
- If answer > 25 then rejected
- If answer < 6 then participant asked to confirm
- If answer > 20 then participant asked to confirm
If the participant activated the Help button they were shown the message:
If you are unsure, please provide an estimate or select Do not know.
|
Coding 100291 defines 2 special values:
- -1 represents "Do not know"
- -3 represents "Prefer not to answer"
0 Related Data-Fields
There are no related data-fields
3 Applications
| Application ID | Title |
|---|
| 26629 | Cross-cultural variations in female reproductive health and non-communicable diseases: analysis of 500,000 participants from the UKBiobank and the InterLACE consortium |
| 5791 | Development and validation of risk prediction model for breast and ovarian cancers |
| 871 | Genetic factors associated with being at different extremes of the reproductive lifespan |


