Data
4,526,573 items of data are available, covering 239,969 participants.
Some values have special meanings defined by Data-Coding
7667.
Defined-instances run from 0 to 3, labelled using Instancing
2.
Array indices run from 1 to 15.
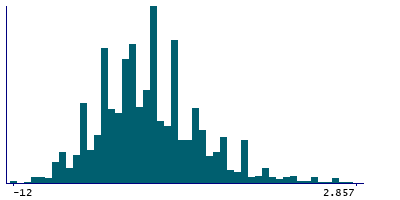
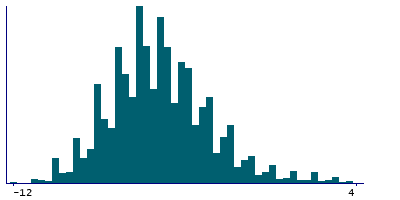
| Maximum | 8 |
| Decile 9 | -3 |
| Decile 8 | -4 |
| Decile 7 | -5 |
| Decile 6 | -6 |
| Median | -6 |
| Decile 4 | -6.85714 |
| Decile 3 | -7.143 |
| Decile 2 | -8 |
| Decile 1 | -8.8 |
| Minimum | -12 |
|
|
- Mean = -5.90762
- Std.dev = 2.61799
- 30173 items above graph maximum of 2.8
- 2119386 items have value -99999 (Not computed)
|
4 Instances
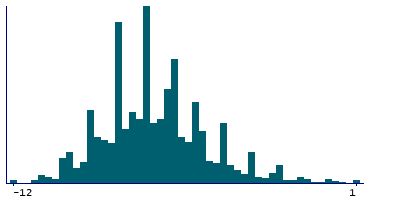
Instance 0 : Initial assessment visit (2006-2010) at which participants were recruited and consent given
165,943 participants, 1,305,826 items
| Maximum | 8 |
| Decile 9 | -4 |
| Decile 8 | -5 |
| Decile 7 | -6 |
| Decile 6 | -6 |
| Median | -6.857 |
| Decile 4 | -7 |
| Decile 3 | -7.714 |
| Decile 2 | -8 |
| Decile 1 | -9 |
| Minimum | -12 |
|
|
- Mean = -6.48019
- Std.dev = 2.36791
- 14700 items above graph maximum of 1
- 1151933 items have value -99999 (Not computed)
|
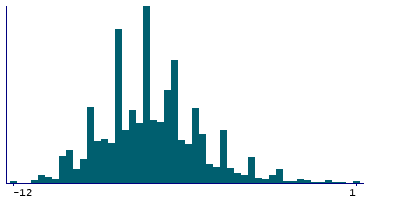
Instance 1 : First repeat assessment visit (2012-13)
19,942 participants, 158,566 items
| Maximum | 8 |
| Decile 9 | -4 |
| Decile 8 | -5 |
| Decile 7 | -6 |
| Decile 6 | -6.333 |
| Median | -7 |
| Decile 4 | -7 |
| Decile 3 | -8 |
| Decile 2 | -8.286 |
| Decile 1 | -9 |
| Minimum | -12 |
|
|
- Mean = -6.61949
- Std.dev = 2.23417
- 1470 items above graph maximum of 1
- 139228 items have value -99999 (Not computed)
|
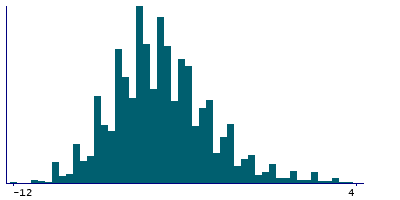
Instance 2 : Imaging visit (2014+)
98,175 participants, 779,540 items
| Maximum | 8 |
| Decile 9 | -2 |
| Decile 8 | -3 |
| Decile 7 | -4 |
| Decile 6 | -4.85714 |
| Median | -5.14286 |
| Decile 4 | -6 |
| Decile 3 | -6.33333 |
| Decile 2 | -7 |
| Decile 1 | -8 |
| Minimum | -12 |
|
|
- Mean = -4.9573
- Std.dev = 2.70564
- 12001 items above graph maximum of 4
- 684858 items have value -99999 (Not computed)
|
Instance 3 : First repeat imaging visit (2019+)
20,553 participants, 163,255 items
| Maximum | 8 |
| Decile 9 | -2 |
| Decile 8 | -3.33333 |
| Decile 7 | -4 |
| Decile 6 | -5 |
| Median | -5.6 |
| Decile 4 | -6 |
| Decile 3 | -6.8 |
| Decile 2 | -7.33333 |
| Decile 1 | -8 |
| Minimum | -12 |
|
|
- Mean = -5.17406
- Std.dev = 2.90575
- 2986 items above graph maximum of 4
- 143367 items have value -99999 (Not computed)
|
Notes
This is the mean signal-to-noise ratio for rounds 8 onwards (left ear). The triplets played in rounds 1-5 represent the 'hunting phase' where the SNR change is 2 levels (equivalent to 4 dB) harder following a correct response and 2 levels easier following a wrong response, as opposed to a change of 1 level (2 dB) in rounds 8 to 15. Value is stored as -99999 for rounds 1-7.
Coding 7667 defines 1 special value:
- -99999 represents "Not computed"


