Data
290,687 items of data are available, covering 230,041 participants.
Defined-instances run from 0 to 3, labelled using Instancing
2.
| Maximum | 102233 |
| Decile 9 | 529 |
| Decile 8 | 399 |
| Decile 7 | 330 |
| Decile 6 | 282 |
| Median | 244 |
| Decile 4 | 212 |
| Decile 3 | 183 |
| Decile 2 | 154 |
| Decile 1 | 121 |
| Minimum | 7 |
|
|
- There are 2170 distinct values.
- Mean = 299.638
- Std.dev = 291.479
- 5139 items above graph maximum of 937
|
4 Instances
Instance 0 : Initial assessment visit (2006-2010) at which participants were recruited and consent given
159,868 participants, 159,868 items
| Maximum | 8580 |
| Decile 9 | 561 |
| Decile 8 | 420 |
| Decile 7 | 344 |
| Decile 6 | 293 |
| Median | 253 |
| Decile 4 | 219 |
| Decile 3 | 188 |
| Decile 2 | 158 |
| Decile 1 | 124 |
| Minimum | 8 |
|

|
- There are 2018 distinct values.
- Mean = 313.723
- Std.dev = 238.246
- 3007 items above graph maximum of 998
|
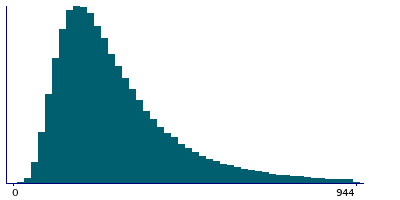
Instance 1 : First repeat assessment visit (2012-13)
19,724 participants, 19,724 items
| Maximum | 4612 |
| Decile 9 | 532 |
| Decile 8 | 407 |
| Decile 7 | 338 |
| Decile 6 | 290 |
| Median | 251 |
| Decile 4 | 219 |
| Decile 3 | 190 |
| Decile 2 | 160 |
| Decile 1 | 127 |
| Minimum | 27 |
|

|
- There are 1139 distinct values.
- Mean = 306.016
- Std.dev = 219.908
- 329 items above graph maximum of 937
|
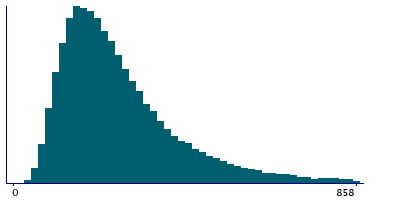
Instance 2 : Imaging visit (2014+)
91,683 participants, 91,683 items
| Maximum | 102233 |
| Decile 9 | 488 |
| Decile 8 | 373 |
| Decile 7 | 310 |
| Decile 6 | 267 |
| Median | 233 |
| Decile 4 | 203 |
| Decile 3 | 176 |
| Decile 2 | 149 |
| Decile 1 | 118 |
| Minimum | 7 |
|
|
- There are 1470 distinct values.
- Mean = 280.606
- Std.dev = 386.838
- 1444 items above graph maximum of 858
|
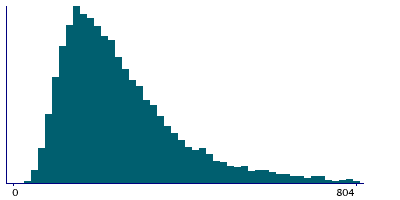
Instance 3 : First repeat imaging visit (2019+)
19,412 participants, 19,412 items
| Maximum | 16360 |
| Decile 9 | 462 |
| Decile 8 | 355 |
| Decile 7 | 298 |
| Decile 6 | 257 |
| Median | 223 |
| Decile 4 | 194 |
| Decile 3 | 167 |
| Decile 2 | 142 |
| Decile 1 | 112 |
| Minimum | 25 |
|
|
- There are 998 distinct values.
- Mean = 267.05
- Std.dev = 210.795
- 324 items above graph maximum of 812
|

