Data
22,911 items of data are available, covering 20,280 participants.
Defined-instances run from 0 to 3, labelled using Instancing
2.
| Maximum | 80808 |
| Decile 9 | 407 |
| Decile 8 | 308 |
| Decile 7 | 252 |
| Decile 6 | 212 |
| Median | 181 |
| Decile 4 | 153 |
| Decile 3 | 125 |
| Decile 2 | 96 |
| Decile 1 | 60 |
| Minimum | 3 |
|
|
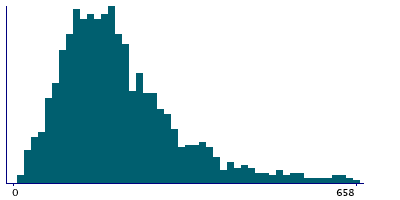
- There are 962 distinct values.
- Mean = 220.602
- Std.dev = 557.066
- 288 items above graph maximum of 754
|
4 Instances
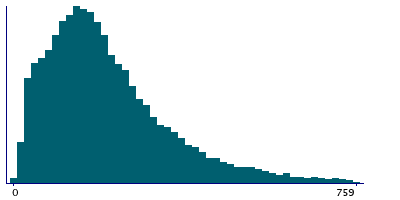
Instance 0 : Initial assessment visit (2006-2010) at which participants were recruited and consent given
11,728 participants, 11,728 items
| Maximum | 2155 |
| Decile 9 | 412 |
| Decile 8 | 310.5 |
| Decile 7 | 250 |
| Decile 6 | 207 |
| Median | 173 |
| Decile 4 | 142 |
| Decile 3 | 112 |
| Decile 2 | 81 |
| Decile 1 | 49 |
| Minimum | 3 |
|
|
- There are 848 distinct values.
- Mean = 212.204
- Std.dev = 169.611
- 153 items above graph maximum of 775
|
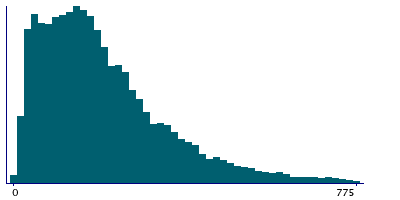
Instance 1 : First repeat assessment visit (2012-13)
1,608 participants, 1,608 items
| Maximum | 2213 |
| Decile 9 | 470.5 |
| Decile 8 | 360.5 |
| Decile 7 | 294 |
| Decile 6 | 243 |
| Median | 208 |
| Decile 4 | 177.5 |
| Decile 3 | 150 |
| Decile 2 | 121 |
| Decile 1 | 79 |
| Minimum | 9 |
|
|
- There are 545 distinct values.
- Mean = 249.932
- Std.dev = 175.488
- 15 items above graph maximum of 862
|
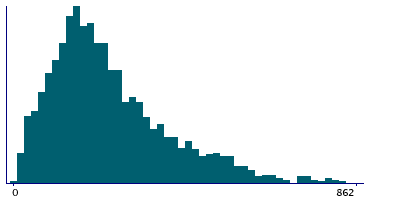
Instance 2 : Imaging visit (2014+)
7,808 participants, 7,808 items
| Maximum | 80808 |
| Decile 9 | 388 |
| Decile 8 | 300 |
| Decile 7 | 250 |
| Decile 6 | 213 |
| Median | 185 |
| Decile 4 | 159 |
| Decile 3 | 135 |
| Decile 2 | 109 |
| Decile 1 | 75 |
| Minimum | 3 |
|
|
- There are 712 distinct values.
- Mean = 228.741
- Std.dev = 925.332
- 111 items above graph maximum of 701
|
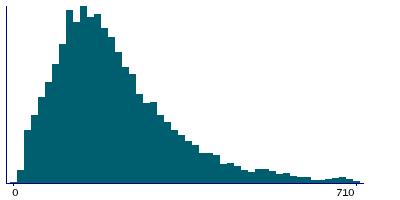
Instance 3 : First repeat imaging visit (2019+)
1,767 participants, 1,767 items
| Maximum | 1511 |
| Decile 9 | 377 |
| Decile 8 | 286 |
| Decile 7 | 242 |
| Decile 6 | 207 |
| Median | 182 |
| Decile 4 | 159 |
| Decile 3 | 136.5 |
| Decile 2 | 113.5 |
| Decile 1 | 82.5 |
| Minimum | 11 |
|
|
- There are 473 distinct values.
- Mean = 213.686
- Std.dev = 139.845
- 21 items above graph maximum of 671
|

