Data
7,942 items of data are available, covering 7,340 participants.
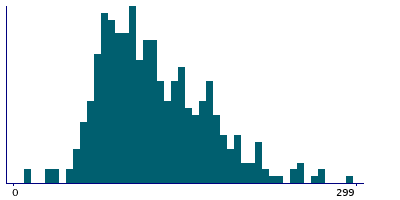
Defined-instances run from 0 to 3, labelled using Instancing
2.
| Maximum | 1249 |
| Decile 9 | 190 |
| Decile 8 | 158 |
| Decile 7 | 139 |
| Decile 6 | 124 |
| Median | 111 |
| Decile 4 | 99 |
| Decile 3 | 88 |
| Decile 2 | 77 |
| Decile 1 | 62 |
| Minimum | 6 |
|
|
- There are 348 distinct values.
- Mean = 120.357
- Std.dev = 57.943
- 53 items above graph maximum of 318
|
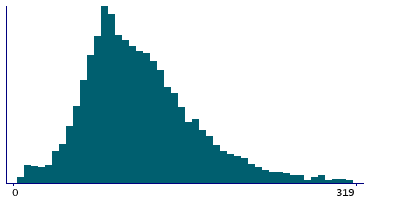
4 Instances
Instance 0 : Initial assessment visit (2006-2010) at which participants were recruited and consent given
4,342 participants, 4,342 items
| Maximum | 1249 |
| Decile 9 | 185 |
| Decile 8 | 152 |
| Decile 7 | 133 |
| Decile 6 | 118 |
| Median | 104 |
| Decile 4 | 91 |
| Decile 3 | 82 |
| Decile 2 | 71 |
| Decile 1 | 55 |
| Minimum | 6 |
|
|
- There are 317 distinct values.
- Mean = 114.608
- Std.dev = 60.4604
- 31 items above graph maximum of 315
|
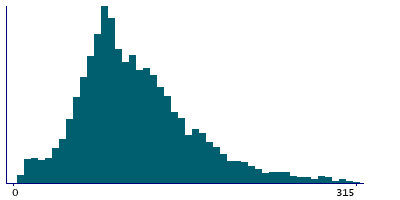
Instance 1 : First repeat assessment visit (2012-13)
441 participants, 441 items
| Maximum | 473 |
| Decile 9 | 201.5 |
| Decile 8 | 163.5 |
| Decile 7 | 145 |
| Decile 6 | 133.5 |
| Median | 117 |
| Decile 4 | 102 |
| Decile 3 | 90.5 |
| Decile 2 | 80 |
| Decile 1 | 66 |
| Minimum | 12 |
|
|
- There are 180 distinct values.
- Mean = 126.238
- Std.dev = 56.9603
- 2 items above graph maximum of 337
|
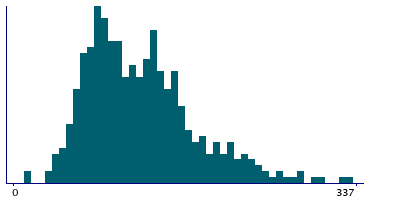
Instance 2 : Imaging visit (2014+)
2,587 participants, 2,587 items
| Maximum | 660 |
| Decile 9 | 195 |
| Decile 8 | 163 |
| Decile 7 | 146 |
| Decile 6 | 131 |
| Median | 119 |
| Decile 4 | 108 |
| Decile 3 | 97 |
| Decile 2 | 85.5 |
| Decile 1 | 71 |
| Minimum | 7 |
|
|
- There are 272 distinct values.
- Mean = 127.565
- Std.dev = 53.9366
- 17 items above graph maximum of 319
|
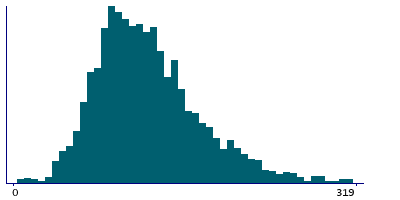
Instance 3 : First repeat imaging visit (2019+)
572 participants, 572 items
| Maximum | 389 |
| Decile 9 | 191 |
| Decile 8 | 165 |
| Decile 7 | 146.5 |
| Decile 6 | 131.5 |
| Median | 118 |
| Decile 4 | 105 |
| Decile 3 | 96 |
| Decile 2 | 84 |
| Decile 1 | 72.5 |
| Minimum | 12 |
|
|
- There are 190 distinct values.
- Mean = 126.86
- Std.dev = 51.5192
- 5 items above graph maximum of 309
|

