Data
643,221 items of data are available, covering 501,110 participants.
Some values have special meanings defined by Data-Coding
100290.
Defined-instances run from 0 to 3, labelled using Instancing
2.
Units of measurement are years.
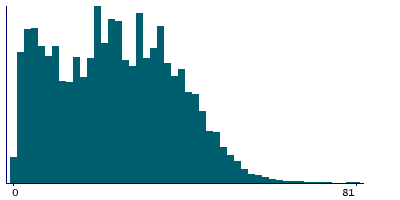
| Maximum | 85 |
| Decile 9 | 36 |
| Decile 8 | 30 |
| Decile 7 | 25 |
| Decile 6 | 22 |
| Median | 18 |
| Decile 4 | 14 |
| Decile 3 | 10 |
| Decile 2 | 7 |
| Decile 1 | 4 |
| Minimum | 1 |
|
|
- There are 85 distinct values.
- Mean = 18.9876
- Std.dev = 12.5385
- 327 items above graph maximum of 68
- 14138 items have value -10 (Less than a year)
- 1304 items have value -3 (Prefer not to answer)
- 692 items have value -1 (Do not know)
|
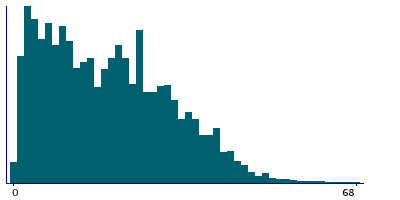
4 Instances
Instance 0 : Initial assessment visit (2006-2010) at which participants were recruited and consent given
501,070 participants, 501,070 items
| Maximum | 70 |
| Decile 9 | 35 |
| Decile 8 | 28 |
| Decile 7 | 24 |
| Decile 6 | 20 |
| Median | 16 |
| Decile 4 | 12 |
| Decile 3 | 9 |
| Decile 2 | 6 |
| Decile 1 | 3 |
| Minimum | 1 |
|
|
- There are 70 distinct values.
- Mean = 17.81
- Std.dev = 11.9163
- 196 items above graph maximum of 67
- 11056 items have value -10 (Less than a year)
- 1196 items have value -3 (Prefer not to answer)
- 604 items have value -1 (Do not know)
|
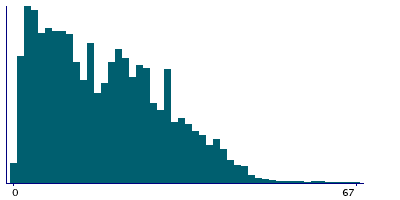
Instance 1 : First repeat assessment visit (2012-13)
20,314 participants, 20,314 items
| Maximum | 79 |
| Decile 9 | 39 |
| Decile 8 | 33 |
| Decile 7 | 29 |
| Decile 6 | 26 |
| Median | 22 |
| Decile 4 | 18 |
| Decile 3 | 14 |
| Decile 2 | 10 |
| Decile 1 | 6 |
| Minimum | 1 |
|
|
- There are 76 distinct values.
- Mean = 22.3564
- Std.dev = 12.4539
- 6 items above graph maximum of 72
- 286 items have value -10 (Less than a year)
- 10 items have value -3 (Prefer not to answer)
- 14 items have value -1 (Do not know)
|
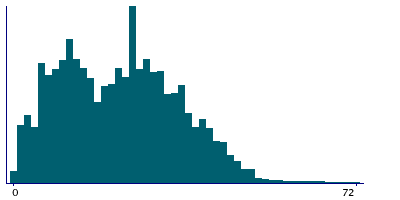
Instance 2 : Imaging visit (2014+)
100,917 participants, 100,917 items
| Maximum | 85 |
| Decile 9 | 41 |
| Decile 8 | 35 |
| Decile 7 | 31 |
| Decile 6 | 27 |
| Median | 22 |
| Decile 4 | 18 |
| Decile 3 | 14 |
| Decile 2 | 9 |
| Decile 1 | 4 |
| Minimum | 1 |
|
|
- There are 83 distinct values.
- Mean = 22.9753
- Std.dev = 13.7865
- 19 items above graph maximum of 78
- 2404 items have value -10 (Less than a year)
- 87 items have value -3 (Prefer not to answer)
- 66 items have value -1 (Do not know)
|
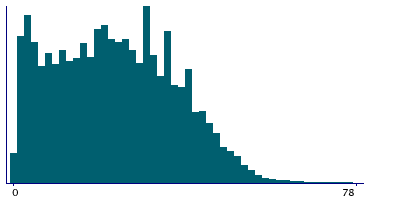
Instance 3 : First repeat imaging visit (2019+)
20,920 participants, 20,920 items
| Maximum | 85 |
| Decile 9 | 44 |
| Decile 8 | 38 |
| Decile 7 | 33 |
| Decile 6 | 29 |
| Median | 24 |
| Decile 4 | 20 |
| Decile 3 | 15 |
| Decile 2 | 10 |
| Decile 1 | 5 |
| Minimum | 1 |
|
|
- There are 84 distinct values.
- Mean = 24.609
- Std.dev = 14.5607
- 4 items above graph maximum of 83
- 392 items have value -10 (Less than a year)
- 11 items have value -3 (Prefer not to answer)
- 8 items have value -1 (Do not know)
|
Notes
ACE touchscreen question "How many years have you lived at your current address?"
The following checks were performed:
- If answer < 1 then rejected
- If answer > Participants age then rejected
If the participant activated the Help button they were shown the message:
If you have lived there for less than one year select Less than a year.
If you are unsure, please provide an estimate or select Do not know.
If you have lived at your current address at different times, add up
the total number of years you lived there. For instance if you lived
at your current address for 3 years, moved overseas for one year and
returned to your current address for another 5 years, then you would
enter 8 years.
|
Coding 100290 defines 3 special values:
- -10 represents "Less than a year"
- -1 represents "Do not know"
- -3 represents "Prefer not to answer"
0 Related Data-Fields
There are no related data-fields


