Data
643,195 items of data are available, covering 501,085 participants.
Some values have special meanings defined by Data-Coding
100373.
Defined-instances run from 0 to 3, labelled using Instancing
2.
Units of measurement are tablespoons/day.
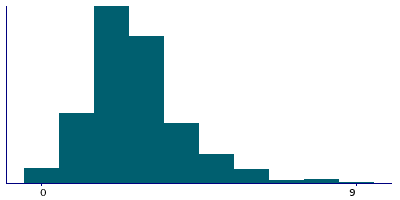
| Maximum | 50 |
| Decile 9 | 5 |
| Decile 8 | 4 |
| Decile 7 | 3 |
| Decile 6 | 3 |
| Median | 3 |
| Decile 4 | 2 |
| Decile 3 | 2 |
| Decile 2 | 2 |
| Decile 1 | 1 |
| Minimum | 0 |
|
|
- There are 44 distinct values.
- Mean = 2.80418
- Std.dev = 1.92181
- 7122 items above graph maximum of 9
- 12441 items have value -10 (Less than one)
- 624 items have value -3 (Prefer not to answer)
- 7040 items have value -1 (Do not know)
|
4 Instances
Instance 0 : Initial assessment visit (2006-2010) at which participants were recruited and consent given
501,044 participants, 501,044 items
| Maximum | 50 |
| Decile 9 | 5 |
| Decile 8 | 4 |
| Decile 7 | 3 |
| Decile 6 | 3 |
| Median | 2 |
| Decile 4 | 2 |
| Decile 3 | 2 |
| Decile 2 | 2 |
| Decile 1 | 1 |
| Minimum | 0 |
|

|
- There are 43 distinct values.
- Mean = 2.77928
- Std.dev = 1.91934
- 5484 items above graph maximum of 9
- 10009 items have value -10 (Less than one)
- 569 items have value -3 (Prefer not to answer)
- 6124 items have value -1 (Do not know)
|
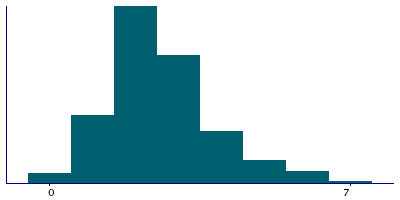
Instance 1 : First repeat assessment visit (2012-13)
20,314 participants, 20,314 items
| Maximum | 50 |
| Decile 9 | 4 |
| Decile 8 | 4 |
| Decile 7 | 3 |
| Decile 6 | 3 |
| Median | 2 |
| Decile 4 | 2 |
| Decile 3 | 2 |
| Decile 2 | 2 |
| Decile 1 | 1 |
| Minimum | 0 |
|
|
- There are 28 distinct values.
- Mean = 2.71343
- Std.dev = 1.79393
- 339 items above graph maximum of 7
- 352 items have value -10 (Less than one)
- 3 items have value -3 (Prefer not to answer)
- 72 items have value -1 (Do not know)
|
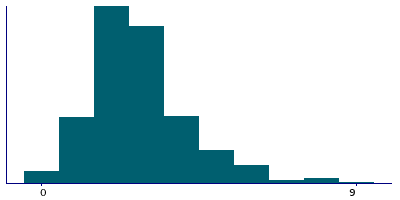
Instance 2 : Imaging visit (2014+)
100,917 participants, 100,917 items
| Maximum | 50 |
| Decile 9 | 5 |
| Decile 8 | 4 |
| Decile 7 | 3 |
| Decile 6 | 3 |
| Median | 3 |
| Decile 4 | 2 |
| Decile 3 | 2 |
| Decile 2 | 2 |
| Decile 1 | 1 |
| Minimum | 0 |
|
|
- There are 37 distinct values.
- Mean = 2.9376
- Std.dev = 1.97508
- 1225 items above graph maximum of 9
- 1690 items have value -10 (Less than one)
- 46 items have value -3 (Prefer not to answer)
- 684 items have value -1 (Do not know)
|
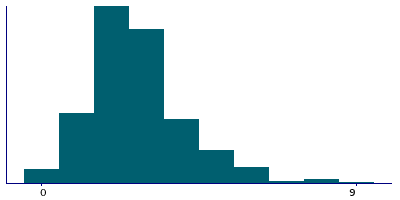
Instance 3 : First repeat imaging visit (2019+)
20,920 participants, 20,920 items
| Maximum | 40 |
| Decile 9 | 5 |
| Decile 8 | 4 |
| Decile 7 | 3 |
| Decile 6 | 3 |
| Median | 3 |
| Decile 4 | 2 |
| Decile 3 | 2 |
| Decile 2 | 2 |
| Decile 1 | 1 |
| Minimum | 0 |
|
|
- There are 26 distinct values.
- Mean = 2.83972
- Std.dev = 1.80805
- 233 items above graph maximum of 9
- 390 items have value -10 (Less than one)
- 6 items have value -3 (Prefer not to answer)
- 160 items have value -1 (Do not know)
|
Notes
ACE touchscreen question "On average how many heaped tablespoons of COOKED vegetables would you eat per DAY? (Do not include potatoes; put '0' if you do not eat any)"
The following checks were performed:
- If answer > 50 then rejected
If the participant activated the Help button they were shown the message:
Please provide an average considering your intake over the last year.
If you are unsure, please provide an estimate or select Do not know.
If you have less than one tablespoon a day select Less than one.
|
Coding 100373 defines 3 special values:
- -10 represents "Less than one"
- -1 represents "Do not know"
- -3 represents "Prefer not to answer"
0 Related Data-Fields
There are no related data-fields


