Data
61,423 items of data are available, covering 6,163 participants.
Defined-instances run from 2 to 3, labelled using Instancing
2.
Array indices run from 1 to 10.
Units of measurement are dioptre.
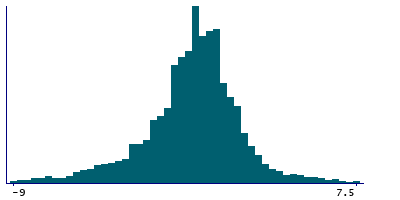
| Maximum | 11.75 |
| Decile 9 | 2 |
| Decile 8 | 1.25 |
| Decile 7 | 0.75 |
| Decile 6 | 0.25 |
| Median | -0.25 |
| Decile 4 | -0.75 |
| Decile 3 | -1.25 |
| Decile 2 | -2 |
| Decile 1 | -3.5 |
| Minimum | -16.5 |
|
|
- Mean = -0.478514
- Std.dev = 2.51698
- 480 items below graph minimum of -9
- 103 items above graph maximum of 7.5
|
2 Instances
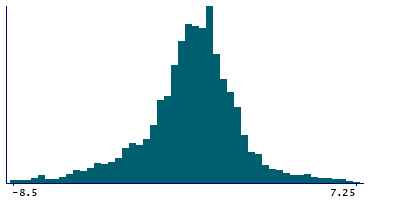
Instance 2 : Imaging visit (2014+)
2,896 participants, 28,843 items
| Maximum | 8.75 |
| Decile 9 | 2 |
| Decile 8 | 1.25 |
| Decile 7 | 0.75 |
| Decile 6 | 0.25 |
| Median | -0.25 |
| Decile 4 | -0.5 |
| Decile 3 | -1 |
| Decile 2 | -1.75 |
| Decile 1 | -3.25 |
| Minimum | -16.5 |
|
|
- Mean = -0.426317
- Std.dev = 2.49323
- 255 items below graph minimum of -8.5
- 75 items above graph maximum of 7.25
|
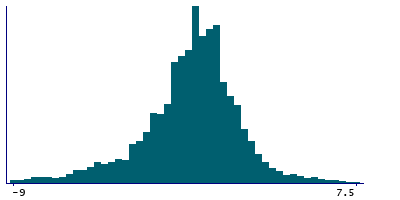
Instance 3 : First repeat imaging visit (2019+)
3,267 participants, 32,580 items
| Maximum | 11.75 |
| Decile 9 | 2 |
| Decile 8 | 1.25 |
| Decile 7 | 0.75 |
| Decile 6 | 0.25 |
| Median | -0.25 |
| Decile 4 | -0.75 |
| Decile 3 | -1.25 |
| Decile 2 | -2 |
| Decile 1 | -3.5 |
| Minimum | -15.25 |
|
|
- Mean = -0.524724
- Std.dev = 2.53693
- 263 items below graph minimum of -9
- 58 items above graph maximum of 7.5
|
Notes
Spherical power (left)
0 Related Data-Fields
There are no related data-fields
0 Resources
There are no matching Resources
