Data
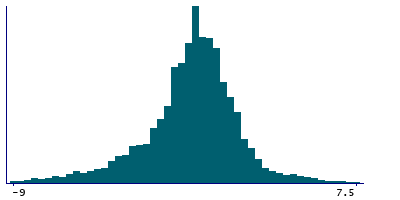
61,367 items of data are available, covering 6,159 participants.
Defined-instances run from 2 to 3, labelled using Instancing
2.
Array indices run from 1 to 10.
Units of measurement are dioptre.
| Maximum | 10.75 |
| Decile 9 | 2 |
| Decile 8 | 1.25 |
| Decile 7 | 0.5 |
| Decile 6 | 0.25 |
| Median | -0.25 |
| Decile 4 | -0.75 |
| Decile 3 | -1.25 |
| Decile 2 | -2 |
| Decile 1 | -3.5 |
| Minimum | -20.75 |
|
|
- Mean = -0.532265
- Std.dev = 2.49564
- 500 items below graph minimum of -9
- 121 items above graph maximum of 7.5
|
2 Instances
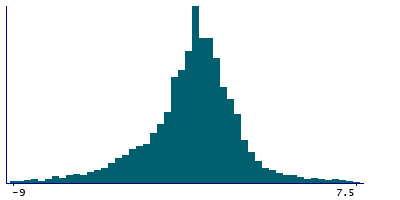
Instance 2 : Imaging visit (2014+)
2,889 participants, 28,769 items
| Maximum | 9.5 |
| Decile 9 | 2 |
| Decile 8 | 1.25 |
| Decile 7 | 0.5 |
| Decile 6 | 0.25 |
| Median | -0.25 |
| Decile 4 | -0.75 |
| Decile 3 | -1.25 |
| Decile 2 | -2 |
| Decile 1 | -3.5 |
| Minimum | -20.75 |
|
|
- Mean = -0.49343
- Std.dev = 2.53681
- 276 items below graph minimum of -9
- 47 items above graph maximum of 7.5
|
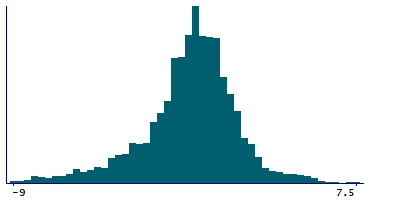
Instance 3 : First repeat imaging visit (2019+)
3,270 participants, 32,598 items
| Maximum | 10.75 |
| Decile 9 | 2 |
| Decile 8 | 1 |
| Decile 7 | 0.5 |
| Decile 6 | 0.25 |
| Median | -0.25 |
| Decile 4 | -0.75 |
| Decile 3 | -1.25 |
| Decile 2 | -2 |
| Decile 1 | -3.5 |
| Minimum | -15 |
|
|
- Mean = -0.566538
- Std.dev = 2.45822
- 224 items below graph minimum of -9
- 74 items above graph maximum of 7.5
|
Notes
Spherical power (right)
0 Related Data-Fields
There are no related data-fields
0 Resources
There are no matching Resources
