Data
61,423 items of data are available, covering 6,163 participants.
Defined-instances run from 2 to 3, labelled using Instancing
2.
Array indices run from 1 to 10.
Units of measurement are dioptre.
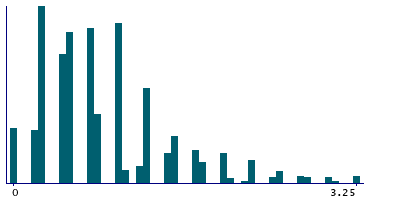
| Maximum | 8.75 |
| Decile 9 | 1.75 |
| Decile 8 | 1.25 |
| Decile 7 | 1 |
| Decile 6 | 1 |
| Median | 0.75 |
| Decile 4 | 0.5 |
| Decile 3 | 0.5 |
| Decile 2 | 0.25 |
| Decile 1 | 0.25 |
| Minimum | 0 |
|
|
- Mean = 0.917946
- Std.dev = 0.751014
- 868 items above graph maximum of 3.25
|
2 Instances
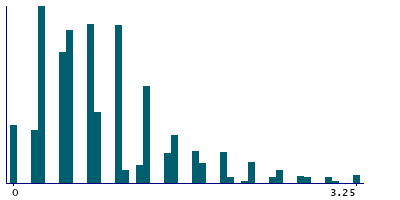
Instance 2 : Imaging visit (2014+)
2,896 participants, 28,843 items
| Maximum | 8 |
| Decile 9 | 1.75 |
| Decile 8 | 1.25 |
| Decile 7 | 1 |
| Decile 6 | 1 |
| Median | 0.75 |
| Decile 4 | 0.5 |
| Decile 3 | 0.5 |
| Decile 2 | 0.25 |
| Decile 1 | 0.25 |
| Minimum | 0 |
|
|
- Mean = 0.917164
- Std.dev = 0.759
- 421 items above graph maximum of 3.25
|
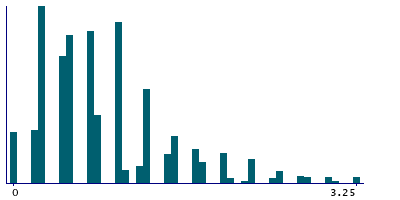
Instance 3 : First repeat imaging visit (2019+)
3,267 participants, 32,580 items
| Maximum | 8.75 |
| Decile 9 | 1.75 |
| Decile 8 | 1.25 |
| Decile 7 | 1 |
| Decile 6 | 1 |
| Median | 0.75 |
| Decile 4 | 0.5 |
| Decile 3 | 0.5 |
| Decile 2 | 0.25 |
| Decile 1 | 0.25 |
| Minimum | 0 |
|
|
- Mean = 0.918639
- Std.dev = 0.743872
- 447 items above graph maximum of 3.25
|
Notes
Cylindrical power (left)
0 Related Data-Fields
There are no related data-fields
0 Resources
There are no matching Resources
