Data
61,423 items of data are available, covering 6,163 participants.
Defined-instances run from 2 to 3, labelled using Instancing
2.
Array indices run from 1 to 10.
Units of measurement are dioptre.
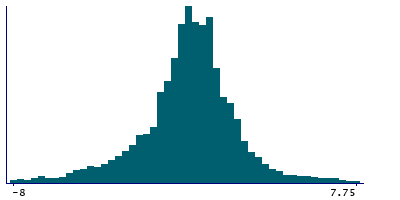
| Maximum | 12.5 |
| Decile 9 | 2.5 |
| Decile 8 | 1.5 |
| Decile 7 | 1 |
| Decile 6 | 0.5 |
| Median | 0.25 |
| Decile 4 | -0.25 |
| Decile 3 | -0.75 |
| Decile 2 | -1.5 |
| Decile 1 | -2.75 |
| Minimum | -15 |
|
|
- Mean = -0.0227114
- Std.dev = 2.44932
- 529 items below graph minimum of -8
- 154 items above graph maximum of 7.75
|
2 Instances
Instance 2 : Imaging visit (2014+)
2,896 participants, 28,843 items
| Maximum | 9.75 |
| Decile 9 | 2.5 |
| Decile 8 | 1.5 |
| Decile 7 | 1 |
| Decile 6 | 0.5 |
| Median | 0.25 |
| Decile 4 | -0.25 |
| Decile 3 | -0.75 |
| Decile 2 | -1.25 |
| Decile 1 | -2.75 |
| Minimum | -15 |
|

|
- Mean = 0.0286985
- Std.dev = 2.42896
- 229 items below graph minimum of -8
- 65 items above graph maximum of 7.75
|
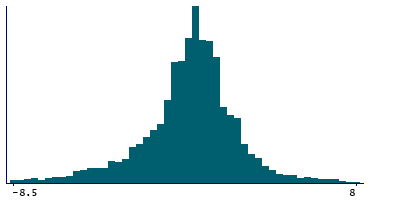
Instance 3 : First repeat imaging visit (2019+)
3,267 participants, 32,580 items
| Maximum | 12.5 |
| Decile 9 | 2.5 |
| Decile 8 | 1.5 |
| Decile 7 | 1 |
| Decile 6 | 0.5 |
| Median | 0.25 |
| Decile 4 | -0.25 |
| Decile 3 | -0.75 |
| Decile 2 | -1.5 |
| Decile 1 | -3 |
| Minimum | -13.75 |
|
|
- Mean = -0.0682244
- Std.dev = 2.46631
- 215 items below graph minimum of -8.5
- 79 items above graph maximum of 8
|
Notes
Spherical equivalent value (left)
0 Related Data-Fields
There are no related data-fields
0 Resources
There are no matching Resources
