Data
61,367 items of data are available, covering 6,159 participants.
Defined-instances run from 2 to 3, labelled using Instancing
2.
Array indices run from 1 to 10.
Units of measurement are dioptre.
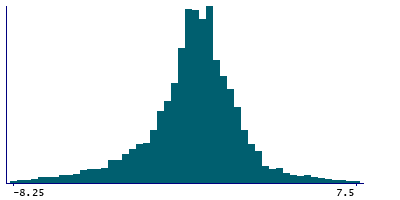
| Maximum | 11.75 |
| Decile 9 | 2.25 |
| Decile 8 | 1.5 |
| Decile 7 | 1 |
| Decile 6 | 0.5 |
| Median | 0.25 |
| Decile 4 | -0.25 |
| Decile 3 | -0.75 |
| Decile 2 | -1.5 |
| Decile 1 | -3 |
| Minimum | -17 |
|
|
- Mean = -0.0613889
- Std.dev = 2.42601
- 469 items below graph minimum of -8.25
- 197 items above graph maximum of 7.5
|
2 Instances
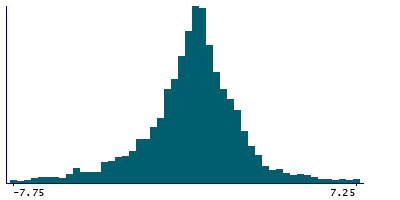
Instance 2 : Imaging visit (2014+)
2,889 participants, 28,769 items
| Maximum | 10.25 |
| Decile 9 | 2.25 |
| Decile 8 | 1.5 |
| Decile 7 | 1 |
| Decile 6 | 0.5 |
| Median | 0.25 |
| Decile 4 | -0.25 |
| Decile 3 | -0.75 |
| Decile 2 | -1.5 |
| Decile 1 | -2.75 |
| Minimum | -17 |
|
|
- Mean = -0.0297195
- Std.dev = 2.46504
- 321 items below graph minimum of -7.75
- 131 items above graph maximum of 7.25
|
Instance 3 : First repeat imaging visit (2019+)
3,270 participants, 32,598 items
| Maximum | 11.75 |
| Decile 9 | 2.25 |
| Decile 8 | 1.5 |
| Decile 7 | 1 |
| Decile 6 | 0.5 |
| Median | 0 |
| Decile 4 | -0.25 |
| Decile 3 | -0.75 |
| Decile 2 | -1.5 |
| Decile 1 | -3 |
| Minimum | -12.75 |
|

|
- Mean = -0.0893383
- Std.dev = 2.3907
- 220 items below graph minimum of -8.25
- 93 items above graph maximum of 7.5
|
Notes
Spherical equivalent value (right)
0 Related Data-Fields
There are no related data-fields
0 Resources
There are no matching Resources
