Data
59,894 items of data are available, covering 6,058 participants.
Defined-instances run from 2 to 3, labelled using Instancing
2.
Array indices run from 1 to 10.
Units of measurement are mm.
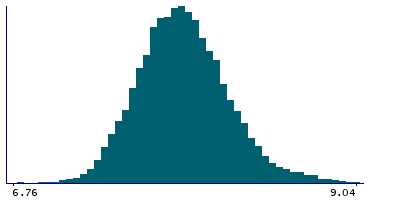
| Maximum | 11.38 |
| Decile 9 | 8.28 |
| Decile 8 | 8.13 |
| Decile 7 | 8.03 |
| Decile 6 | 7.95 |
| Median | 7.88 |
| Decile 4 | 7.8 |
| Decile 3 | 7.73 |
| Decile 2 | 7.64 |
| Decile 1 | 7.52 |
| Minimum | 5.57 |
|
|
- Mean = 7.89431
- Std.dev = 0.322329
- 66 items below graph minimum of 6.76
- 259 items above graph maximum of 9.04
|
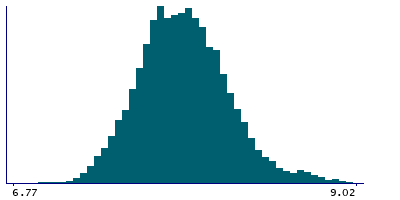
2 Instances
Instance 2 : Imaging visit (2014+)
2,823 participants, 27,798 items
| Maximum | 11.11 |
| Decile 9 | 8.27 |
| Decile 8 | 8.12 |
| Decile 7 | 8.03 |
| Decile 6 | 7.95 |
| Median | 7.87 |
| Decile 4 | 7.8 |
| Decile 3 | 7.72 |
| Decile 2 | 7.64 |
| Decile 1 | 7.52 |
| Minimum | 5.57 |
|
|
- Mean = 7.89116
- Std.dev = 0.317993
- 42 items below graph minimum of 6.77
- 118 items above graph maximum of 9.02
|
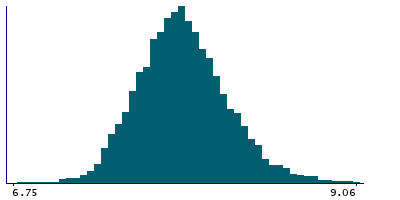
Instance 3 : First repeat imaging visit (2019+)
3,235 participants, 32,096 items
| Maximum | 11.38 |
| Decile 9 | 8.29 |
| Decile 8 | 8.13 |
| Decile 7 | 8.03 |
| Decile 6 | 7.95 |
| Median | 7.88 |
| Decile 4 | 7.81 |
| Decile 3 | 7.73 |
| Decile 2 | 7.64 |
| Decile 1 | 7.52 |
| Minimum | 5.82 |
|
|
- Mean = 7.89703
- Std.dev = 0.326012
- 27 items below graph minimum of 6.75
- 139 items above graph maximum of 9.06
|
Notes
Keratometry R1 radius (right)
0 Related Data-Fields
There are no related data-fields
0 Resources
There are no matching Resources
