Data
59,894 items of data are available, covering 6,058 participants.
Defined-instances run from 2 to 3, labelled using Instancing
2.
Array indices run from 1 to 10.
Units of measurement are dioptre.
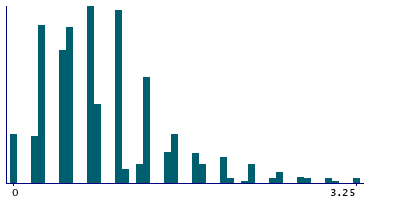
| Maximum | 11.75 |
| Decile 9 | 1.75 |
| Decile 8 | 1.25 |
| Decile 7 | 1 |
| Decile 6 | 1 |
| Median | 0.75 |
| Decile 4 | 0.5 |
| Decile 3 | 0.5 |
| Decile 2 | 0.5 |
| Decile 1 | 0.25 |
| Minimum | 0 |
|
|
- Mean = 0.910463
- Std.dev = 0.741667
- 749 items above graph maximum of 3.25
|
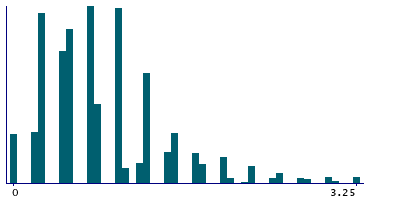
2 Instances
Instance 2 : Imaging visit (2014+)
2,823 participants, 27,798 items
| Maximum | 11.75 |
| Decile 9 | 1.75 |
| Decile 8 | 1.25 |
| Decile 7 | 1 |
| Decile 6 | 1 |
| Median | 0.75 |
| Decile 4 | 0.5 |
| Decile 3 | 0.5 |
| Decile 2 | 0.5 |
| Decile 1 | 0.25 |
| Minimum | 0 |
|
|
- Mean = 0.905119
- Std.dev = 0.740773
- 360 items above graph maximum of 3.25
|
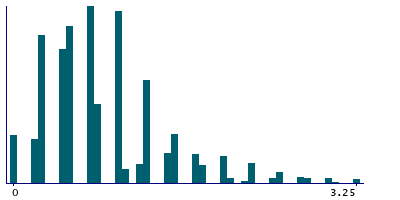
Instance 3 : First repeat imaging visit (2019+)
3,235 participants, 32,096 items
| Maximum | 10.75 |
| Decile 9 | 1.75 |
| Decile 8 | 1.25 |
| Decile 7 | 1 |
| Decile 6 | 1 |
| Median | 0.75 |
| Decile 4 | 0.5 |
| Decile 3 | 0.5 |
| Decile 2 | 0.5 |
| Decile 1 | 0.25 |
| Minimum | 0 |
|
|
- Mean = 0.915091
- Std.dev = 0.74241
- 389 items above graph maximum of 3.25
|
Notes
Keratometry spherical value (right)
0 Related Data-Fields
There are no related data-fields
0 Resources
There are no matching Resources
