Data
59,995 items of data are available, covering 6,061 participants.
Defined-instances run from 2 to 3, labelled using Instancing
2.
Array indices run from 1 to 10.
Units of measurement are dioptre.
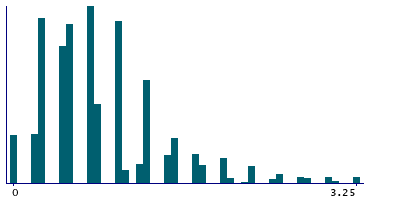
| Maximum | 12.25 |
| Decile 9 | 1.75 |
| Decile 8 | 1.25 |
| Decile 7 | 1 |
| Decile 6 | 0.75 |
| Median | 0.75 |
| Decile 4 | 0.5 |
| Decile 3 | 0.5 |
| Decile 2 | 0.5 |
| Decile 1 | 0.25 |
| Minimum | 0 |
|
|
- Mean = 0.888499
- Std.dev = 0.715009
- 674 items above graph maximum of 3.25
|
2 Instances
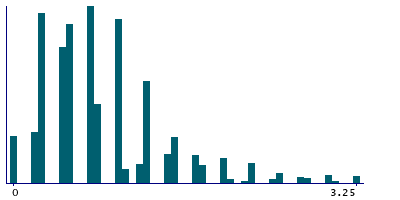
Instance 2 : Imaging visit (2014+)
2,834 participants, 27,963 items
| Maximum | 12.25 |
| Decile 9 | 1.75 |
| Decile 8 | 1.25 |
| Decile 7 | 1 |
| Decile 6 | 0.75 |
| Median | 0.75 |
| Decile 4 | 0.5 |
| Decile 3 | 0.5 |
| Decile 2 | 0.5 |
| Decile 1 | 0.25 |
| Minimum | 0 |
|
|
- Mean = 0.899662
- Std.dev = 0.731167
- 338 items above graph maximum of 3.25
|
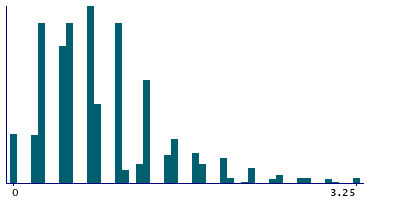
Instance 3 : First repeat imaging visit (2019+)
3,227 participants, 32,032 items
| Maximum | 10.75 |
| Decile 9 | 1.75 |
| Decile 8 | 1.25 |
| Decile 7 | 1 |
| Decile 6 | 0.75 |
| Median | 0.75 |
| Decile 4 | 0.5 |
| Decile 3 | 0.5 |
| Decile 2 | 0.5 |
| Decile 1 | 0.25 |
| Minimum | 0 |
|
|
- Mean = 0.878754
- Std.dev = 0.700454
- 336 items above graph maximum of 3.25
|
Notes
Keratometry spherical value (left)
0 Related Data-Fields
There are no related data-fields
0 Resources
There are no matching Resources
