Data
262,329 items of data are available, covering 220,772 participants.
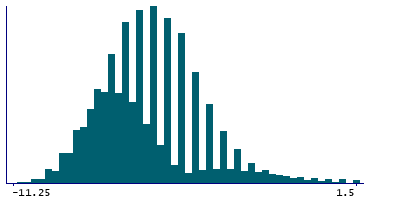
Defined-instances run from 0 to 3, labelled using Instancing
2.
| Maximum | 8 |
| Decile 9 | -3.5 |
| Decile 8 | -4.5 |
| Decile 7 | -5.5 |
| Decile 6 | -6 |
| Median | -6.5 |
| Decile 4 | -7 |
| Decile 3 | -7.5 |
| Decile 2 | -8 |
| Decile 1 | -8.5 |
| Minimum | -11.25 |
|
|
- Mean = -6.10469
- Std.dev = 2.30767
- 3025 items above graph maximum of 1.5
|
4 Instances
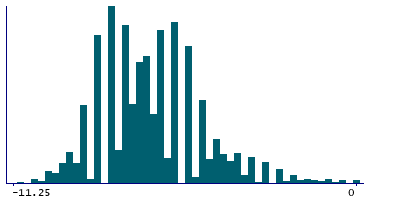
Instance 0 : Initial assessment visit (2006-2010) at which participants were recruited and consent given
163,206 participants, 163,206 items
| Maximum | 8 |
| Decile 9 | -4.5 |
| Decile 8 | -5.5 |
| Decile 7 | -6 |
| Decile 6 | -6.5 |
| Median | -7 |
| Decile 4 | -7.5 |
| Decile 3 | -7.5 |
| Decile 2 | -8 |
| Decile 1 | -8.5 |
| Minimum | -11.25 |
|
|
- Mean = -6.58695
- Std.dev = 2.09704
- 1847 items above graph maximum of 0
|
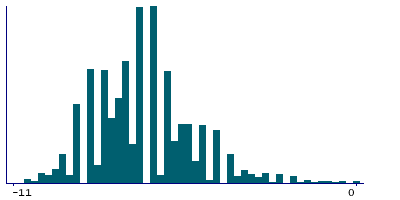
Instance 1 : First repeat assessment visit (2012-13)
19,835 participants, 19,835 items
| Maximum | 8 |
| Decile 9 | -4.5 |
| Decile 8 | -5.5 |
| Decile 7 | -6 |
| Decile 6 | -6.5 |
| Median | -7 |
| Decile 4 | -7.5 |
| Decile 3 | -7.5 |
| Decile 2 | -8 |
| Decile 1 | -8.5 |
| Minimum | -11 |
|
|
- Mean = -6.70579
- Std.dev = 1.97254
- 188 items above graph maximum of 0
|
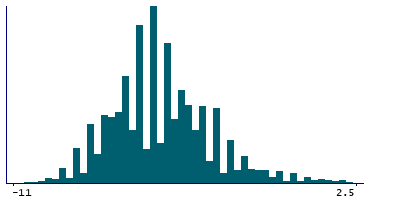
Instance 2 : Imaging visit (2014+)
72,479 participants, 72,479 items
| Maximum | 8 |
| Decile 9 | -2.5 |
| Decile 8 | -3.5 |
| Decile 7 | -4 |
| Decile 6 | -5 |
| Median | -5.5 |
| Decile 4 | -5.5 |
| Decile 3 | -6 |
| Decile 2 | -7 |
| Decile 1 | -7.5 |
| Minimum | -11 |
|
|
- Mean = -4.97172
- Std.dev = 2.40367
- 1244 items above graph maximum of 2.5
|
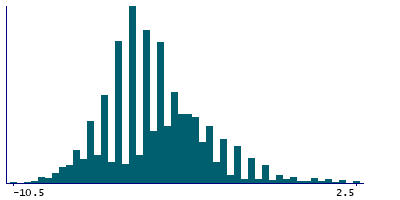
Instance 3 : First repeat imaging visit (2019+)
6,809 participants, 6,809 items
| Maximum | 8 |
| Decile 9 | -2.5 |
| Decile 8 | -3.5 |
| Decile 7 | -4 |
| Decile 6 | -4.5 |
| Median | -5 |
| Decile 4 | -5.5 |
| Decile 3 | -6 |
| Decile 2 | -6.5 |
| Decile 1 | -7.5 |
| Minimum | -10.5 |
|
|
- Mean = -4.85416
- Std.dev = 2.25205
- 90 items above graph maximum of 2.5
|