Data
4,102,705 items of data are available, covering 229,110 participants.
Some values have special meanings defined by Data-Coding
7667.
Defined-instances run from 0 to 3, labelled using Instancing
2.
Array indices run from 1 to 15.
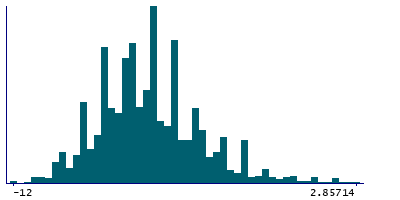
| Maximum | 8 |
| Decile 9 | -3 |
| Decile 8 | -4.28571 |
| Decile 7 | -5 |
| Decile 6 | -6 |
| Median | -6 |
| Decile 4 | -7 |
| Decile 3 | -7.2 |
| Decile 2 | -8 |
| Decile 1 | -8.85714 |
| Minimum | -12 |
|
|
- Mean = -5.96456
- Std.dev = 2.5825
- 25255 items above graph maximum of 2.85714
- 1921188 items have value -99999 (Not computed)
|
4 Instances
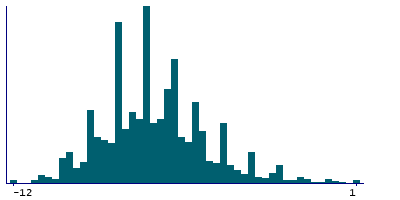
Instance 0 : Initial assessment visit (2006-2010) at which participants were recruited and consent given
166,006 participants, 1,306,330 items
| Maximum | 8 |
| Decile 9 | -4 |
| Decile 8 | -5 |
| Decile 7 | -6 |
| Decile 6 | -6 |
| Median | -6.857 |
| Decile 4 | -7 |
| Decile 3 | -7.714 |
| Decile 2 | -8 |
| Decile 1 | -9 |
| Minimum | -12 |
|
|
- Mean = -6.4804
- Std.dev = 2.36782
- 14700 items above graph maximum of 1
- 1152374 items have value -99999 (Not computed)
|
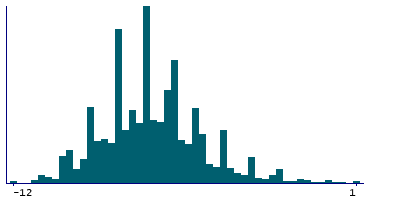
Instance 1 : First repeat assessment visit (2012-13)
19,956 participants, 158,678 items
| Maximum | 8 |
| Decile 9 | -4 |
| Decile 8 | -5 |
| Decile 7 | -6 |
| Decile 6 | -6.333 |
| Median | -7 |
| Decile 4 | -7 |
| Decile 3 | -8 |
| Decile 2 | -8.286 |
| Decile 1 | -9 |
| Minimum | -12 |
|
|
- Mean = -6.62005
- Std.dev = 2.23408
- 1470 items above graph maximum of 1
- 139326 items have value -99999 (Not computed)
|
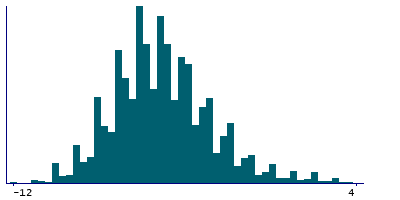
Instance 2 : Imaging visit (2014+)
81,558 participants, 647,440 items
| Maximum | 8 |
| Decile 9 | -2 |
| Decile 8 | -3 |
| Decile 7 | -4 |
| Decile 6 | -4.66667 |
| Median | -5 |
| Decile 4 | -6 |
| Decile 3 | -6 |
| Decile 2 | -7 |
| Decile 1 | -8 |
| Minimum | -12 |
|
|
- Mean = -4.88595
- Std.dev = 2.69397
- 10008 items above graph maximum of 4
- 568892 items have value -99999 (Not computed)
|
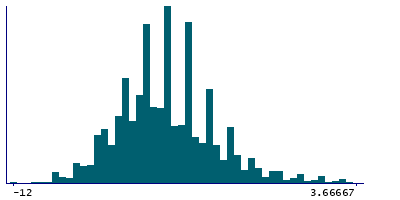
Instance 3 : First repeat imaging visit (2019+)
8,677 participants, 69,069 items
| Maximum | 8 |
| Decile 9 | -2 |
| Decile 8 | -3 |
| Decile 7 | -4 |
| Decile 6 | -4.57143 |
| Median | -5 |
| Decile 4 | -5.66667 |
| Decile 3 | -6 |
| Decile 2 | -7 |
| Decile 1 | -7.66667 |
| Minimum | -12 |
|
|
- Mean = -4.81286
- Std.dev = 2.61918
- 1013 items above graph maximum of 3.66667
- 60596 items have value -99999 (Not computed)
|
Notes
This is the mean signal-to-noise ratio for rounds 8 onwards (left ear). The triplets played in rounds 1-5 represent the 'hunting phase' where the SNR change is 2 levels (equivalent to 4 dB) harder following a correct response and 2 levels easier following a wrong response, as opposed to a change of 1 level (2 dB) in rounds 8 to 15. Value is stored as -99999 for rounds 1-7.
Coding 7667 defines 1 special value:
- -99999 represents "Not computed"