Data
4,104,312 items of data are available, covering 229,206 participants.
Some values have special meanings defined by Data-Coding
7667.
Defined-instances run from 0 to 3, labelled using Instancing
2.
Array indices run from 1 to 15.
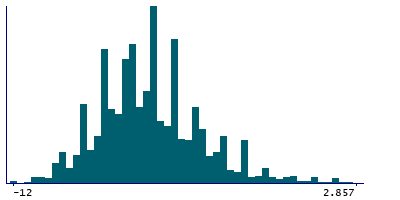
| Maximum | 8 |
| Decile 9 | -3 |
| Decile 8 | -4 |
| Decile 7 | -5 |
| Decile 6 | -6 |
| Median | -6 |
| Decile 4 | -7 |
| Decile 3 | -7.143 |
| Decile 2 | -8 |
| Decile 1 | -8.857 |
| Minimum | -12 |
|
|
- Mean = -5.93992
- Std.dev = 2.57506
- 24704 items above graph maximum of 2.857
- 1922170 items have value -99999 (Not computed)
|
4 Instances
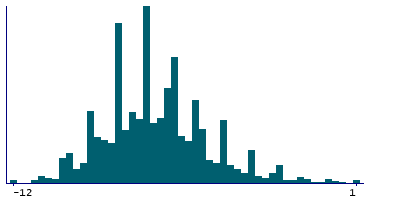
Instance 0 : Initial assessment visit (2006-2010) at which participants were recruited and consent given
166,061 participants, 1,305,986 items
| Maximum | 8 |
| Decile 9 | -4 |
| Decile 8 | -5 |
| Decile 7 | -6 |
| Decile 6 | -6 |
| Median | -6.8 |
| Decile 4 | -7 |
| Decile 3 | -7.667 |
| Decile 2 | -8 |
| Decile 1 | -9 |
| Minimum | -12 |
|
|
- Mean = -6.43825
- Std.dev = 2.3797
- 15056 items above graph maximum of 1
- 1152423 items have value -99999 (Not computed)
|
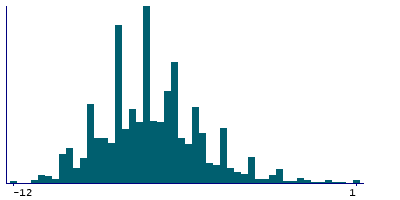
Instance 1 : First repeat assessment visit (2012-13)
19,966 participants, 158,763 items
| Maximum | 8 |
| Decile 9 | -4 |
| Decile 8 | -5 |
| Decile 7 | -6 |
| Decile 6 | -6.333 |
| Median | -7 |
| Decile 4 | -7.143 |
| Decile 3 | -8 |
| Decile 2 | -8.333 |
| Decile 1 | -9 |
| Minimum | -12 |
|
|
- Mean = -6.61766
- Std.dev = 2.29292
- 1629 items above graph maximum of 1
- 139397 items have value -99999 (Not computed)
|
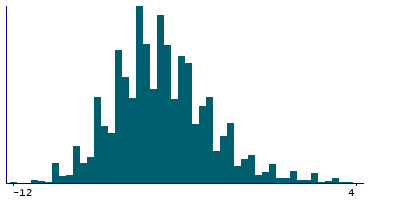
Instance 2 : Imaging visit (2014+)
81,645 participants, 648,278 items
| Maximum | 8 |
| Decile 9 | -2 |
| Decile 8 | -3 |
| Decile 7 | -4 |
| Decile 6 | -4.66667 |
| Median | -5 |
| Decile 4 | -6 |
| Decile 3 | -6 |
| Decile 2 | -7 |
| Decile 1 | -8 |
| Minimum | -12 |
|
|
- Mean = -4.89556
- Std.dev = 2.6603
- 9430 items above graph maximum of 4
- 569680 items have value -99999 (Not computed)
|
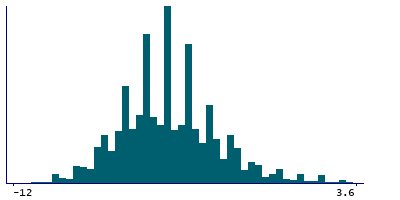
Instance 3 : First repeat imaging visit (2019+)
8,693 participants, 69,115 items
| Maximum | 8 |
| Decile 9 | -2 |
| Decile 8 | -3 |
| Decile 7 | -4 |
| Decile 6 | -4.5 |
| Median | -5 |
| Decile 4 | -5.6 |
| Decile 3 | -6 |
| Decile 2 | -6.8 |
| Decile 1 | -7.6 |
| Minimum | -12 |
|
|
- Mean = -4.76262
- Std.dev = 2.55473
- 924 items above graph maximum of 3.6
- 60670 items have value -99999 (Not computed)
|
Notes
This is the mean signal-to-noise ratio for rounds 8 onwards (right ear). The triplets played in rounds 1-5 represent the 'hunting phase' where the SNR change is 2 levels (equivalent to 4 dB) harder following a correct response and 2 levels easier following a wrong response, as opposed to a change of 1 level (2 dB) in rounds 8 to 15. Value is stored as -99999 for rounds 1-7.
Coding 7667 defines 1 special value:
- -99999 represents "Not computed"