Data
272,552 items of data are available, covering 226,166 participants.
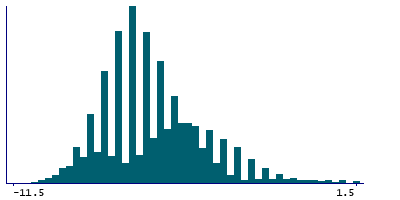
Defined-instances run from 0 to 3, labelled using Instancing
2.
| Maximum | 8 |
| Decile 9 | -3.5 |
| Decile 8 | -4.5 |
| Decile 7 | -5.5 |
| Decile 6 | -6 |
| Median | -6.5 |
| Decile 4 | -7 |
| Decile 3 | -7.5 |
| Decile 2 | -8 |
| Decile 1 | -8.5 |
| Minimum | -11.5 |
|
|
- Mean = -6.04515
- Std.dev = 2.32308
- 3210 items above graph maximum of 1.5
|
4 Instances
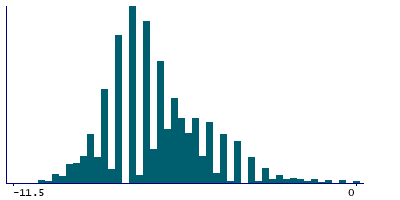
Instance 0 : Initial assessment visit (2006-2010) at which participants were recruited and consent given
163,091 participants, 163,091 items
| Maximum | 8 |
| Decile 9 | -4.5 |
| Decile 8 | -5.5 |
| Decile 7 | -6 |
| Decile 6 | -6.5 |
| Median | -7 |
| Decile 4 | -7 |
| Decile 3 | -7.5 |
| Decile 2 | -8 |
| Decile 1 | -8.5 |
| Minimum | -11.5 |
|
|
- Mean = -6.54659
- Std.dev = 2.10865
- 1866 items above graph maximum of 0
|
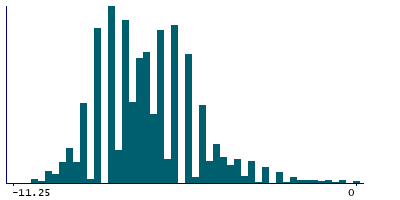
Instance 1 : First repeat assessment visit (2012-13)
19,837 participants, 19,837 items
| Maximum | 8 |
| Decile 9 | -4.5 |
| Decile 8 | -5.5 |
| Decile 7 | -6 |
| Decile 6 | -6.5 |
| Median | -7 |
| Decile 4 | -7.5 |
| Decile 3 | -7.5 |
| Decile 2 | -8 |
| Decile 1 | -8.5 |
| Minimum | -11.25 |
|
|
- Mean = -6.6965
- Std.dev = 2.01019
- 208 items above graph maximum of 0
|
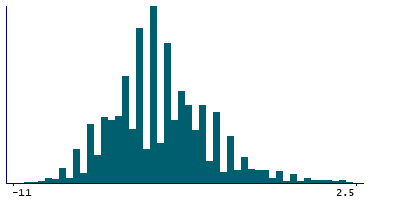
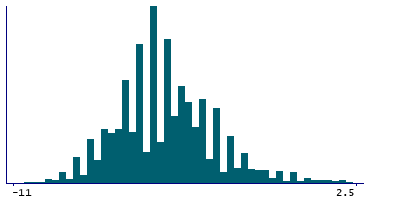
Instance 2 : Imaging visit (2014+)
80,989 participants, 80,989 items
| Maximum | 8 |
| Decile 9 | -2.5 |
| Decile 8 | -3.5 |
| Decile 7 | -4.5 |
| Decile 6 | -5 |
| Median | -5.5 |
| Decile 4 | -6 |
| Decile 3 | -6 |
| Decile 2 | -7 |
| Decile 1 | -7.5 |
| Minimum | -11 |
|
|
- Mean = -5.00206
- Std.dev = 2.4105
- 1379 items above graph maximum of 2.5
|
Instance 3 : First repeat imaging visit (2019+)
8,635 participants, 8,635 items
| Maximum | 8 |
| Decile 9 | -2.5 |
| Decile 8 | -3.5 |
| Decile 7 | -4 |
| Decile 6 | -4.5 |
| Median | -5 |
| Decile 4 | -5.5 |
| Decile 3 | -6 |
| Decile 2 | -6.5 |
| Decile 1 | -7.5 |
| Minimum | -11 |
|
|
- Mean = -4.86141
- Std.dev = 2.29116
- 124 items above graph maximum of 2.5
|