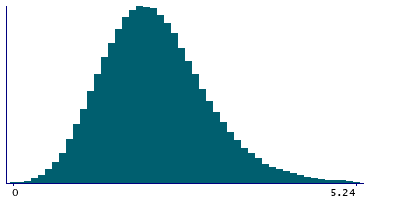
Data
457,988 items of data are available, covering 210,751 participants.
Defined-instances run from 0 to 4, labelled using Instancing
1.
Units of measurement are mg.
| Maximum | 20.39 |
| Decile 9 | 3.22 |
| Decile 8 | 2.8 |
| Decile 7 | 2.52 |
| Decile 6 | 2.3 |
| Median | 2.1 |
| Decile 4 | 1.91 |
| Decile 3 | 1.71 |
| Decile 2 | 1.49 |
| Decile 1 | 1.2 |
| Minimum | 0 |
|
|
- Mean = 2.17511
- Std.dev = 0.829887
- 1547 items above graph maximum of 5.24
|
5 Instances
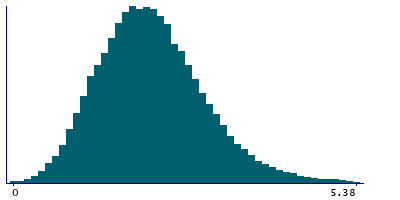
Instance 0 : Conducted in assessment centre, April 2009 to September 2010.
70,663 participants, 70,663 items
| Maximum | 20.39 |
| Decile 9 | 3.27 |
| Decile 8 | 2.84 |
| Decile 7 | 2.55 |
| Decile 6 | 2.31 |
| Median | 2.11 |
| Decile 4 | 1.9 |
| Decile 3 | 1.7 |
| Decile 2 | 1.46 |
| Decile 1 | 1.16 |
| Minimum | 0 |
|
|
- Mean = 2.18529
- Std.dev = 0.876935
- 270 items above graph maximum of 5.38
|
Instance 1 : On-line cycle 1, February 2011 to April 2011.
100,445 participants, 100,445 items
| Maximum | 14.45 |
| Decile 9 | 3.21 |
| Decile 8 | 2.8 |
| Decile 7 | 2.52 |
| Decile 6 | 2.3 |
| Median | 2.1 |
| Decile 4 | 1.91 |
| Decile 3 | 1.72 |
| Decile 2 | 1.5 |
| Decile 1 | 1.21 |
| Minimum | 0 |
|

|
- Mean = 2.17619
- Std.dev = 0.815733
- 319 items above graph maximum of 5.21
|
Instance 2 : On-line cycle 2, June 2011 to September 2011.
83,139 participants, 83,139 items
| Maximum | 19.28 |
| Decile 9 | 3.25 |
| Decile 8 | 2.83 |
| Decile 7 | 2.55 |
| Decile 6 | 2.32 |
| Median | 2.12 |
| Decile 4 | 1.92 |
| Decile 3 | 1.72 |
| Decile 2 | 1.49 |
| Decile 1 | 1.2 |
| Minimum | 0 |
|

|
- Mean = 2.19004
- Std.dev = 0.837096
- 285 items above graph maximum of 5.3
|
Instance 3 : On-line cycle 3, October 2011 to December 2011.
103,614 participants, 103,614 items
| Maximum | 13.21 |
| Decile 9 | 3.18 |
| Decile 8 | 2.76 |
| Decile 7 | 2.49 |
| Decile 6 | 2.27 |
| Median | 2.08 |
| Decile 4 | 1.89 |
| Decile 3 | 1.69 |
| Decile 2 | 1.48 |
| Decile 1 | 1.19 |
| Minimum | 0 |
|

|
- Mean = 2.14685
- Std.dev = 0.806299
- 304 items above graph maximum of 5.17
|
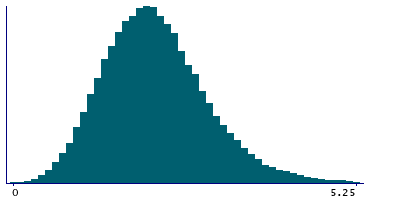
Instance 4 : On-line cycle 4, April 2012 to June 2012.
100,127 participants, 100,127 items
| Maximum | 14.83 |
| Decile 9 | 3.23 |
| Decile 8 | 2.8 |
| Decile 7 | 2.52 |
| Decile 6 | 2.31 |
| Median | 2.11 |
| Decile 4 | 1.92 |
| Decile 3 | 1.72 |
| Decile 2 | 1.5 |
| Decile 1 | 1.21 |
| Minimum | 0 |
|
|
- Mean = 2.18369
- Std.dev = 0.827168
- 346 items above graph maximum of 5.25
|

