Data
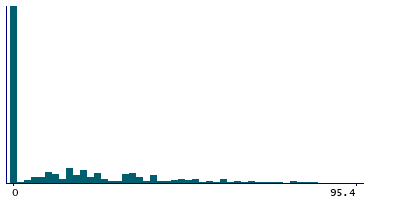
457,988 items of data are available, covering 210,751 participants.
Defined-instances run from 0 to 4, labelled using Instancing
1.
Units of measurement are g.
| Maximum | 329.45 |
| Decile 9 | 47.7 |
| Decile 8 | 33.56 |
| Decile 7 | 19.52 |
| Decile 6 | 14.1 |
| Median | 3.85 |
| Decile 4 | 0 |
| Decile 3 | 0 |
| Decile 2 | 0 |
| Decile 1 | 0 |
| Minimum | 0 |
|
|
- Mean = 16.2429
- Std.dev = 23.4965
- 6623 items above graph maximum of 95.4
|
5 Instances
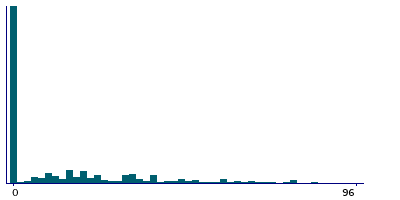
Instance 0 : Conducted in assessment centre, April 2009 to September 2010.
70,663 participants, 70,663 items
| Maximum | 274.5 |
| Decile 9 | 48 |
| Decile 8 | 32.18 |
| Decile 7 | 19.52 |
| Decile 6 | 11.19 |
| Median | 0.07 |
| Decile 4 | 0 |
| Decile 3 | 0 |
| Decile 2 | 0 |
| Decile 1 | 0 |
| Minimum | 0 |
|
|
- Mean = 15.8746
- Std.dev = 24.127
- 1182 items above graph maximum of 96
|
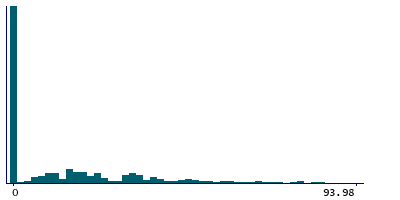
Instance 1 : On-line cycle 1, February 2011 to April 2011.
100,445 participants, 100,445 items
| Maximum | 255.21 |
| Decile 9 | 46.99 |
| Decile 8 | 32.46 |
| Decile 7 | 19.52 |
| Decile 6 | 14.1 |
| Median | 3.66 |
| Decile 4 | 0 |
| Decile 3 | 0 |
| Decile 2 | 0 |
| Decile 1 | 0 |
| Minimum | 0 |
|

|
- Mean = 16.0744
- Std.dev = 23.1929
- 1426 items above graph maximum of 93.98
|
Instance 2 : On-line cycle 2, June 2011 to September 2011.
83,139 participants, 83,139 items
| Maximum | 275.2 |
| Decile 9 | 49.28 |
| Decile 8 | 33.6 |
| Decile 7 | 22.37 |
| Decile 6 | 15.66 |
| Median | 7.05 |
| Decile 4 | 0 |
| Decile 3 | 0 |
| Decile 2 | 0 |
| Decile 1 | 0 |
| Minimum | 0 |
|

|
- Mean = 17.2621
- Std.dev = 24.101
- 968 items above graph maximum of 98.56
|
Instance 3 : On-line cycle 3, October 2011 to December 2011.
103,614 participants, 103,614 items
| Maximum | 289.19 |
| Decile 9 | 46.99 |
| Decile 8 | 32.46 |
| Decile 7 | 19.52 |
| Decile 6 | 14.1 |
| Median | 3.85 |
| Decile 4 | 0 |
| Decile 3 | 0 |
| Decile 2 | 0 |
| Decile 1 | 0 |
| Minimum | 0 |
|

|
- Mean = 15.949
- Std.dev = 23.0652
- 1415 items above graph maximum of 93.98
|
Instance 4 : On-line cycle 4, April 2012 to June 2012.
100,127 participants, 100,127 items
| Maximum | 329.45 |
| Decile 9 | 46.99 |
| Decile 8 | 32.46 |
| Decile 7 | 19.52 |
| Decile 6 | 14.1 |
| Median | 5.42 |
| Decile 4 | 0 |
| Decile 3 | 0 |
| Decile 2 | 0 |
| Decile 1 | 0 |
| Minimum | 0 |
|
|
- Mean = 16.1297
- Std.dev = 23.2576
- 1432 items above graph maximum of 93.98
|

