Data
208,253 items of data are available, covering 88,355 participants.
Defined-instances run from 2 to 3, labelled using Instancing
2.
Array indices run from 0 to 5.
Units of measurement are beats.
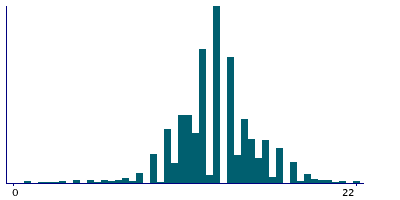
| Maximum | 31 |
| Decile 9 | 16 |
| Decile 8 | 15 |
| Decile 7 | 14 |
| Decile 6 | 13 |
| Median | 13 |
| Decile 4 | 12 |
| Decile 3 | 12 |
| Decile 2 | 11 |
| Decile 1 | 10 |
| Minimum | 1 |
|
|
- Mean = 12.9034
- Std.dev = 2.68692
- 297 items above graph maximum of 22
|
2 Instances
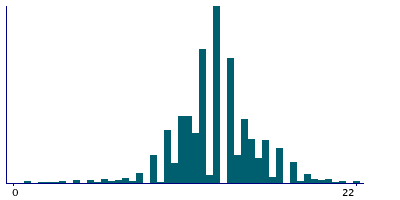
Instance 2 : Imaging visit (2014+)
85,743 participants, 170,991 items
| Maximum | 31 |
| Decile 9 | 16 |
| Decile 8 | 15 |
| Decile 7 | 14 |
| Decile 6 | 13 |
| Median | 13 |
| Decile 4 | 12 |
| Decile 3 | 12 |
| Decile 2 | 11 |
| Decile 1 | 10 |
| Minimum | 1 |
|
|
- Mean = 12.913
- Std.dev = 2.68773
- 253 items above graph maximum of 22
|
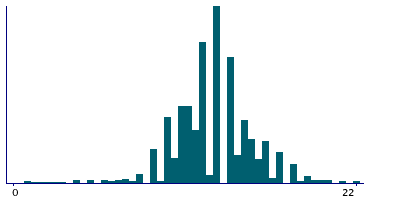
Instance 3 : First repeat imaging visit (2019+)
18,648 participants, 37,262 items
| Maximum | 29 |
| Decile 9 | 16 |
| Decile 8 | 15 |
| Decile 7 | 14 |
| Decile 6 | 13 |
| Median | 13 |
| Decile 4 | 12 |
| Decile 3 | 12 |
| Decile 2 | 11 |
| Decile 1 | 10 |
| Minimum | 1 |
|
|
- Mean = 12.8592
- Std.dev = 2.68279
- 44 items above graph maximum of 22
|
Notes
Number of beats in waveform average for PWA
Note that this field is arrayed to enable representation of the 5 measures of BP acquired during and immediately after the Aortic Distensibility image acquisiton.
0 Related Data-Fields
There are no related data-fields

