Data
624,749 items of data are available, covering 501,109 participants.
Defined-instances run from 0 to 3, labelled using Instancing
2.
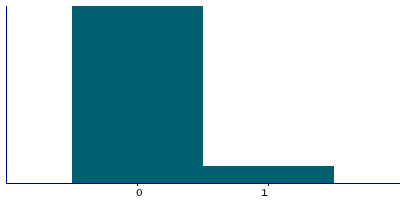
| Maximum | 6 |
| Decile 9 | 0 |
| Decile 8 | 0 |
| Decile 7 | 0 |
| Decile 6 | 0 |
| Median | 0 |
| Decile 4 | 0 |
| Decile 3 | 0 |
| Decile 2 | 0 |
| Decile 1 | 0 |
| Minimum | 0 |
|
|
- There are 7 distinct values.
- Mean = 0.103718
- Std.dev = 0.33192
- 4328 items above graph maximum of 1
|
4 Instances
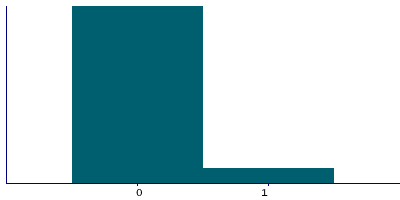
Instance 0 : Initial assessment visit (2006-2010) at which participants were recruited and consent given
501,076 participants, 501,076 items
| Maximum | 6 |
| Decile 9 | 0 |
| Decile 8 | 0 |
| Decile 7 | 0 |
| Decile 6 | 0 |
| Median | 0 |
| Decile 4 | 0 |
| Decile 3 | 0 |
| Decile 2 | 0 |
| Decile 1 | 0 |
| Minimum | 0 |
|
|
- There are 7 distinct values.
- Mean = 0.0893138
- Std.dev = 0.308589
- 2772 items above graph maximum of 1
|
Instance 1 : First repeat assessment visit (2012-13)
20,313 participants, 20,313 items
| Maximum | 4 |
| Decile 9 | 1 |
| Decile 8 | 0 |
| Decile 7 | 0 |
| Decile 6 | 0 |
| Median | 0 |
| Decile 4 | 0 |
| Decile 3 | 0 |
| Decile 2 | 0 |
| Decile 1 | 0 |
| Minimum | 0 |
|
|
- There are 5 distinct values.
- Mean = 0.119628
- Std.dev = 0.349082
- 13 items above graph maximum of 2
|
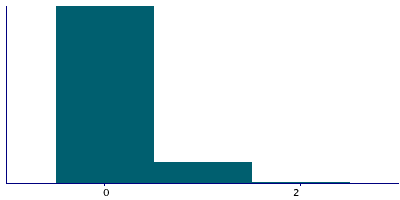
Instance 2 : Imaging visit (2014+)
89,066 participants, 89,066 items
| Maximum | 6 |
| Decile 9 | 1 |
| Decile 8 | 0 |
| Decile 7 | 0 |
| Decile 6 | 0 |
| Median | 0 |
| Decile 4 | 0 |
| Decile 3 | 0 |
| Decile 2 | 0 |
| Decile 1 | 0 |
| Minimum | 0 |
|
|
- There are 7 distinct values.
- Mean = 0.169818
- Std.dev = 0.418141
- 111 items above graph maximum of 2
|
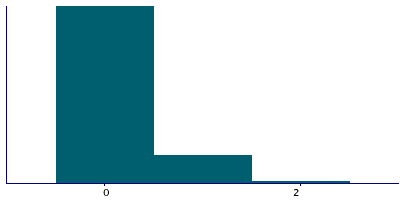
Instance 3 : First repeat imaging visit (2019+)
14,294 participants, 14,294 items
| Maximum | 4 |
| Decile 9 | 1 |
| Decile 8 | 0 |
| Decile 7 | 0 |
| Decile 6 | 0 |
| Median | 0 |
| Decile 4 | 0 |
| Decile 3 | 0 |
| Decile 2 | 0 |
| Decile 1 | 0 |
| Minimum | 0 |
|

|
- There are 5 distinct values.
- Mean = 0.174199
- Std.dev = 0.417895
- 15 items above graph maximum of 2
|


