Data
79,868 items of data are available, covering 51,121 participants.
Defined-instances run from 0 to 1, labelled using Instancing
178.
Array indices run from 1 to 25.
Units of measurement are error-count.
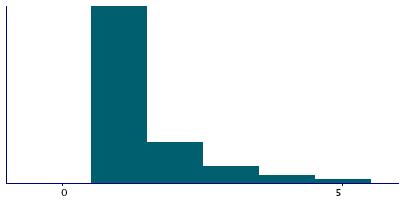
| Maximum | 155 |
| Decile 9 | 3 |
| Decile 8 | 2 |
| Decile 7 | 2 |
| Decile 6 | 1 |
| Median | 1 |
| Decile 4 | 1 |
| Decile 3 | 1 |
| Decile 2 | 1 |
| Decile 1 | 1 |
| Minimum | 1 |
|
|
- There are 59 distinct values.
- Mean = 1.92251
- Std.dev = 2.82192
- 3531 items above graph maximum of 5
|
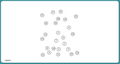
2 Instances
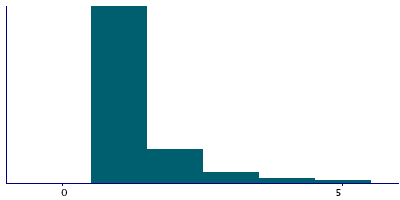
Instance 0 : Assessment run 2014
26,333 participants, 44,149 items
| Maximum | 155 |
| Decile 9 | 3 |
| Decile 8 | 2 |
| Decile 7 | 1 |
| Decile 6 | 1 |
| Median | 1 |
| Decile 4 | 1 |
| Decile 3 | 1 |
| Decile 2 | 1 |
| Decile 1 | 1 |
| Minimum | 1 |
|
|
- There are 59 distinct values.
- Mean = 1.93859
- Std.dev = 3.35468
- 2066 items above graph maximum of 5
|
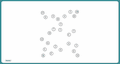
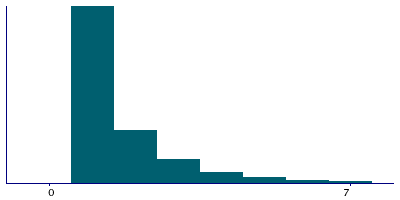
Instance 1 : Assessment run 2021
28,386 participants, 35,719 items
| Maximum | 37 |
| Decile 9 | 4 |
| Decile 8 | 2 |
| Decile 7 | 2 |
| Decile 6 | 1 |
| Median | 1 |
| Decile 4 | 1 |
| Decile 3 | 1 |
| Decile 2 | 1 |
| Decile 1 | 1 |
| Minimum | 1 |
|
|
- There are 29 distinct values.
- Mean = 1.90263
- Std.dev = 1.97366
- 834 items above graph maximum of 7
|