Data
303,206 items of data are available, covering 211,570 participants.
Defined-instances run from 0 to 1, labelled using Instancing
178.
Units of measurement are deciseconds.
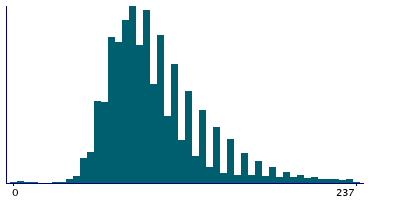
| Maximum | 9999 |
| Decile 9 | 150 |
| Decile 8 | 121 |
| Decile 7 | 110 |
| Decile 6 | 100 |
| Median | 90 |
| Decile 4 | 85 |
| Decile 3 | 80 |
| Decile 2 | 70 |
| Decile 1 | 63 |
| Minimum | 0 |
|
|
- There are 795 distinct values.
- Mean = 104.003
- Std.dev = 83.9134
- 6235 items above graph maximum of 237
|
2 Instances
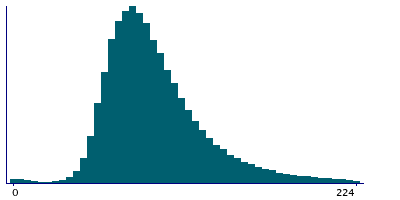
Instance 0 : Assessment run 2014
122,985 participants, 122,985 items
| Maximum | 9999 |
| Decile 9 | 142 |
| Decile 8 | 117 |
| Decile 7 | 104 |
| Decile 6 | 94 |
| Median | 87 |
| Decile 4 | 80 |
| Decile 3 | 74 |
| Decile 2 | 67 |
| Decile 1 | 60 |
| Minimum | 0 |
|
|
- There are 748 distinct values.
- Mean = 99.2318
- Std.dev = 113.966
- 2606 items above graph maximum of 224
|
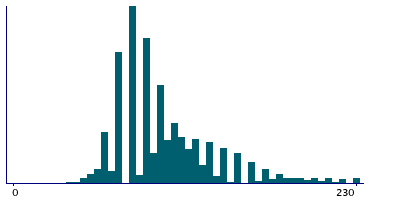
Instance 1 : Assessment run 2021
180,221 participants, 180,221 items
| Maximum | 1200 |
| Decile 9 | 150 |
| Decile 8 | 130 |
| Decile 7 | 110 |
| Decile 6 | 100 |
| Median | 90 |
| Decile 4 | 90 |
| Decile 3 | 80 |
| Decile 2 | 80 |
| Decile 1 | 70 |
| Minimum | 30 |
|
|
- There are 116 distinct values.
- Mean = 107.26
- Std.dev = 54.3805
- 3999 items above graph maximum of 230
|
Notes
Indicates how long a participant viewed question FI1 before selecting their answer and clicking Next.
2 Related Data-Fields
| Field ID | Description | Relationship |
|---|
| 4936 | FI1 : duration viewed | Field 4936 is the touchscreen equivalent of web-based Current Field |
| 20165 | FI1 : numeric addition test | Current Field is the duration spent viewing before entering the answer in Field 20165 |