Data
302,564 items of data are available, covering 211,197 participants.
Defined-instances run from 0 to 1, labelled using Instancing
178.
Units of measurement are deciseconds.
| Maximum | 9957 |
| Decile 9 | 180 |
| Decile 8 | 140 |
| Decile 7 | 120 |
| Decile 6 | 100 |
| Median | 90 |
| Decile 4 | 80 |
| Decile 3 | 75 |
| Decile 2 | 69 |
| Decile 1 | 60 |
| Minimum | 9 |
|

|
- There are 644 distinct values.
- Mean = 111.057
- Std.dev = 84.3392
- 5920 items above graph maximum of 300
|
2 Instances
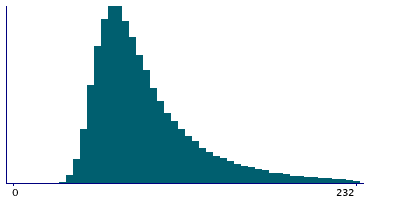
Instance 0 : Assessment run 2014
122,976 participants, 122,976 items
| Maximum | 9957 |
| Decile 9 | 144 |
| Decile 8 | 115 |
| Decile 7 | 99 |
| Decile 6 | 89 |
| Median | 81 |
| Decile 4 | 74 |
| Decile 3 | 68 |
| Decile 2 | 63 |
| Decile 1 | 56 |
| Minimum | 9 |
|
|
- There are 599 distinct values.
- Mean = 94.5863
- Std.dev = 95.7649
- 2151 items above graph maximum of 232
|
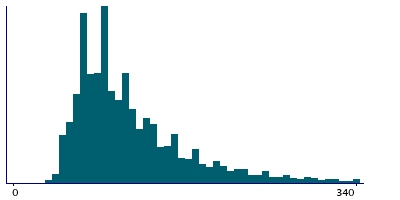
Instance 1 : Assessment run 2021
179,588 participants, 179,588 items
| Maximum | 1070 |
| Decile 9 | 200 |
| Decile 8 | 160 |
| Decile 7 | 130 |
| Decile 6 | 110 |
| Median | 100 |
| Decile 4 | 90 |
| Decile 3 | 80 |
| Decile 2 | 70 |
| Decile 1 | 60 |
| Minimum | 10 |
|
|
- There are 101 distinct values.
- Mean = 122.335
- Std.dev = 73.4235
- 3309 items above graph maximum of 340
|
Notes
Indicates how long a participant viewed question FI3 before selecting their answer and clicking Next.
2 Related Data-Fields
| Field ID | Description | Relationship |
|---|
| 4958 | FI3 : duration viewed | Field 4958 is the touchscreen equivalent of web-based Current Field |
| 20169 | FI3 : word interpolation | Current Field is the duration spent viewing before entering the answer in Field 20169 |