Data
122,855 items of data are available, covering 101,799 participants.
Defined-instances run from 2 to 3, labelled using Instancing
2.
Units of measurement are seconds.
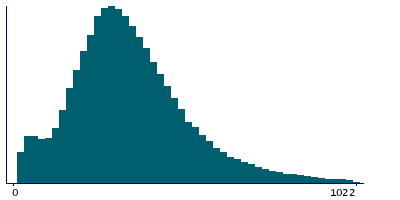
| Maximum | 4224 |
| Decile 9 | 588 |
| Decile 8 | 481 |
| Decile 7 | 419 |
| Decile 6 | 373 |
| Median | 333 |
| Decile 4 | 297 |
| Decile 3 | 261 |
| Decile 2 | 221 |
| Decile 1 | 165 |
| Minimum | 16 |
|
|
- There are 1425 distinct values.
- Mean = 361.302
- Std.dev = 186.633
- 1040 items above graph maximum of 1011
|
2 Instances
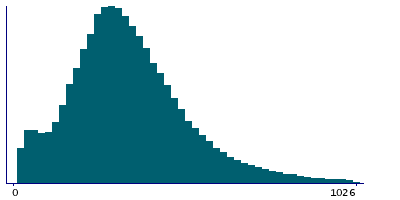
Instance 2 : Imaging visit (2014+)
101,794 participants, 101,794 items
| Maximum | 4224 |
| Decile 9 | 585 |
| Decile 8 | 477 |
| Decile 7 | 415 |
| Decile 6 | 367 |
| Median | 326 |
| Decile 4 | 289 |
| Decile 3 | 252 |
| Decile 2 | 210 |
| Decile 1 | 151 |
| Minimum | 16 |
|
|
- There are 1387 distinct values.
- Mean = 354.355
- Std.dev = 189.234
- 813 items above graph maximum of 1019
|
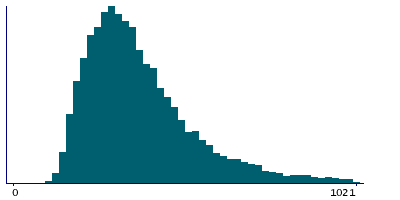
Instance 3 : First repeat imaging visit (2019+)
21,061 participants, 21,061 items
| Maximum | 2914 |
| Decile 9 | 600 |
| Decile 8 | 497 |
| Decile 7 | 439 |
| Decile 6 | 395 |
| Median | 359 |
| Decile 4 | 327 |
| Decile 3 | 297 |
| Decile 2 | 265 |
| Decile 1 | 227 |
| Minimum | 99 |
|
|
- There are 1014 distinct values.
- Mean = 394.878
- Std.dev = 169.549
- 231 items above graph maximum of 973
|
Notes
Imaging screening duration
0 Related Data-Fields
There are no related data-fields
0 Resources
There are no matching Resources
