Data
72,351 items of data are available, covering 64,196 participants.
Defined-instances run from 2 to 3, labelled using Instancing
2.
Units of measurement are seconds.
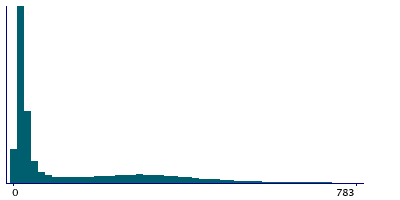
| Maximum | 2494 |
| Decile 9 | 390 |
| Decile 8 | 283 |
| Decile 7 | 181 |
| Decile 6 | 68 |
| Median | 33 |
| Decile 4 | 23 |
| Decile 3 | 18 |
| Decile 2 | 15 |
| Decile 1 | 11 |
| Minimum | 4 |
|
|
- There are 1125 distinct values.
- Mean = 136.399
- Std.dev = 180.225
- 641 items above graph maximum of 769
|
2 Instances
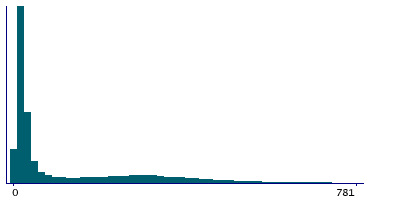
Instance 2 : Imaging visit (2014+)
57,618 participants, 57,618 items
| Maximum | 2494 |
| Decile 9 | 401 |
| Decile 8 | 293 |
| Decile 7 | 186 |
| Decile 6 | 67 |
| Median | 32 |
| Decile 4 | 23 |
| Decile 3 | 18 |
| Decile 2 | 14 |
| Decile 1 | 11 |
| Minimum | 4 |
|
|
- There are 1106 distinct values.
- Mean = 139.503
- Std.dev = 185.916
- 511 items above graph maximum of 791
|
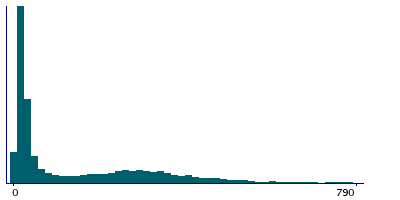
Instance 3 : First repeat imaging visit (2019+)
14,733 participants, 14,733 items
| Maximum | 1745 |
| Decile 9 | 345 |
| Decile 8 | 249 |
| Decile 7 | 169 |
| Decile 6 | 73 |
| Median | 36 |
| Decile 4 | 25 |
| Decile 3 | 20 |
| Decile 2 | 16 |
| Decile 1 | 12 |
| Minimum | 5 |
|
|
- There are 728 distinct values.
- Mean = 124.259
- Std.dev = 155.396
- 118 items above graph maximum of 678
|
Notes
Cardiac monitor duration
0 Related Data-Fields
There are no related data-fields
0 Resources
There are no matching Resources
