Data
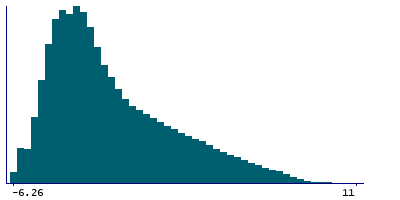
501,315 items of data are available, covering 501,315 participants.
| Maximum | 11 |
| Decile 9 | 3.41 |
| Decile 8 | 1.35 |
| Decile 7 | -0.15 |
| Decile 6 | -1.3 |
| Median | -2.14 |
| Decile 4 | -2.76 |
| Decile 3 | -3.34 |
| Decile 2 | -3.93 |
| Decile 1 | -4.57 |
| Minimum | -6.26 |
|
|
- Mean = -1.29374
- Std.dev = 3.09497
- 1 item above graph maximum of 11
|
Notes
Townsend deprivation index calculated immediately prior to participant joining UK Biobank. Based on the preceding national census output areas. Each participant is assigned a score corresponding to the output area in which their postcode is located.
The values here are rounded to 2 decimal places, replacing an earlier unrounded version.
0 Related Data-Fields
There are no related data-fields
0 Resources
There are no matching Resources
