Data
473,553 items of data are available, covering 473,551 participants.
Defined-instances run from 0 to 2, labelled using Instancing
2.
Units of measurement are ratio.
| Maximum | 12.1395 |
| Decile 9 | 1.24206 |
| Decile 8 | 0.806548 |
| Decile 7 | 0.499854 |
| Decile 6 | 0.238996 |
| Median | -0.00246404 |
| Decile 4 | -0.242885 |
| Decile 3 | -0.502929 |
| Decile 2 | -0.810391 |
| Decile 1 | -1.24387 |
| Minimum | -15.2824 |
|
|
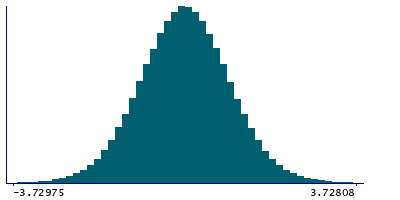
- Mean = -0.000168479
- Std.dev = 1.00006
- 301 items below graph minimum of -3.7298
- 413 items above graph maximum of 3.72799
|
3 Instances
Instance 0 : Initial assessment visit (2006-2010) at which participants were recruited and consent given
472,087 participants, 472,087 items
| Maximum | 12.1395 |
| Decile 9 | 1.24208 |
| Decile 8 | 0.806779 |
| Decile 7 | 0.500098 |
| Decile 6 | 0.239359 |
| Median | -0.00201006 |
| Decile 4 | -0.24244 |
| Decile 3 | -0.502488 |
| Decile 2 | -0.809882 |
| Decile 1 | -1.2433 |
| Minimum | -15.2824 |
|

|
- Mean = 0.000219825
- Std.dev = 0.99982
- 299 items below graph minimum of -3.72868
- 412 items above graph maximum of 3.72746
|
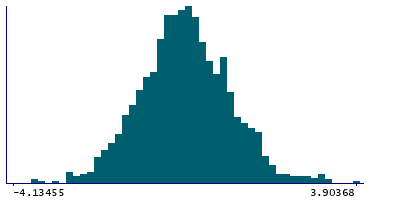
Instance 1 : First repeat assessment visit (2012-13)
1,410 participants, 1,410 items
| Maximum | 3.90368 |
| Decile 9 | 1.22938 |
| Decile 8 | 0.748024 |
| Decile 7 | 0.380022 |
| Decile 6 | 0.104827 |
| Median | -0.137336 |
| Decile 4 | -0.383807 |
| Decile 3 | -0.634757 |
| Decile 2 | -0.973534 |
| Decile 1 | -1.45313 |
| Minimum | -5.18808 |
|
|
- Mean = -0.119894
- Std.dev = 1.06501
- 2 items below graph minimum of -4.13563
|
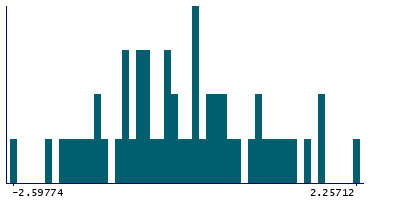
Instance 2 : Imaging visit (2014+)
56 participants, 56 items
| Maximum | 2.25712 |
| Decile 9 | 1.29697 |
| Decile 8 | 0.767933 |
| Decile 7 | 0.319537 |
| Decile 6 | -0.0211056 |
| Median | -0.363235 |
| Decile 4 | -0.597662 |
| Decile 3 | -0.828919 |
| Decile 2 | -1.08778 |
| Decile 1 | -1.67881 |
| Minimum | -2.59774 |
|
|
- Mean = -0.259119
- Std.dev = 1.07746
|
Notes
Technically adjusted leucocyte telomere length (
Field 22191) which has been both loge-transformed to obtain a normal distribution and then Z-standardised using the distribution of all individuals with a telomere length measurement. We recommend the use of these measurements to allow comparison to other studies where Z-standardised measures are available Full details of these measures and adjustments can be found in Codd, V. et al (
https://doi.org/10.1101/2021.03.18.21253457), and exemplar use of the measurements, including a GWAS, can be found in Codd, V. et al (
https://doi.org/10.1101/2021.03.23.21253516.)
1 Related Data-Field
| Field ID | Description | Relationship |
|---|
| 22191 | Adjusted T/S ratio | Current Field is an adjusted form of Field 22191 |
0 Resources
There are no matching Resources
