Data
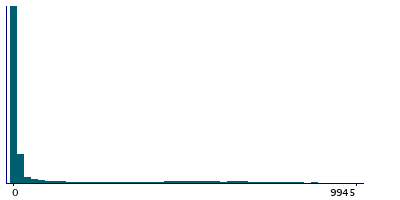
9,960 items of data are available, covering 9,683 participants.
Defined-instances run from 0 to 1, labelled using Instancing
2.
| Maximum | 13150 |
| Decile 9 | 4973 |
| Decile 8 | 818 |
| Decile 7 | 98 |
| Decile 6 | 36 |
| Median | 21 |
| Decile 4 | 14 |
| Decile 3 | 9 |
| Decile 2 | 4 |
| Decile 1 | 1 |
| Minimum | 1 |
|
|
- There are 2317 distinct values.
- Mean = 1022.97
- Std.dev = 2226.45
- 36 items above graph maximum of 9945
|
2 Instances
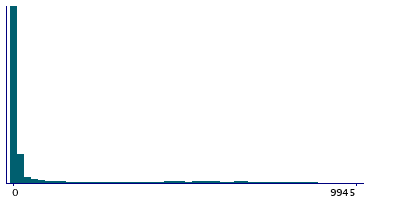
Instance 0 : Initial assessment visit (2006-2010) at which participants were recruited and consent given
9,423 participants, 9,423 items
| Maximum | 13150 |
| Decile 9 | 4973 |
| Decile 8 | 859 |
| Decile 7 | 100 |
| Decile 6 | 37 |
| Median | 21 |
| Decile 4 | 14 |
| Decile 3 | 9 |
| Decile 2 | 4 |
| Decile 1 | 1 |
| Minimum | 1 |
|
|
- There are 2234 distinct values.
- Mean = 1030.47
- Std.dev = 2232.42
- 35 items above graph maximum of 9945
|
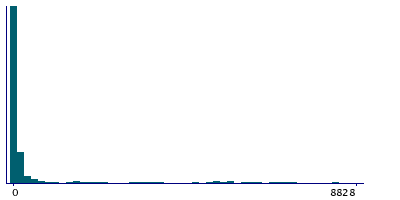
Instance 1 : First repeat assessment visit (2012-13)
537 participants, 537 items
| Maximum | 11644 |
| Decile 9 | 4414.5 |
| Decile 8 | 396.5 |
| Decile 7 | 64.5 |
| Decile 6 | 33 |
| Median | 22 |
| Decile 4 | 16 |
| Decile 3 | 9.5 |
| Decile 2 | 5 |
| Decile 1 | 1 |
| Minimum | 1 |
|
|
- There are 213 distinct values.
- Mean = 891.399
- Std.dev = 2114.58
- 6 items above graph maximum of 8828
|
Notes
Measured level of GroEL antigen for H. pylori (Helicobacter pylori).
0 Related Data-Fields
There are no related data-fields
0 Resources
There are no matching Resources
1 Application
| Application ID | Title |
|---|
| 45925 | Risk Factors, Biomarkers and Impact of Major Vision-Threatening Eye Diseases |
