Data
73,670 items of data are available, covering 68,408 participants.
Defined-instances run from 2 to 3, labelled using Instancing
2.
Units of measurement are g.
| Maximum | 215.466 |
| Decile 9 | 98.8888 |
| Decile 8 | 88.3176 |
| Decile 7 | 81.1091 |
| Decile 6 | 75.2367 |
| Median | 69.9631 |
| Decile 4 | 65.0765 |
| Decile 3 | 60.1995 |
| Decile 2 | 55.1332 |
| Decile 1 | 49.1744 |
| Minimum | 3.82502 |
|

|
- Mean = 72.4369
- Std.dev = 19.8535
- 148 items above graph maximum of 148.603
|
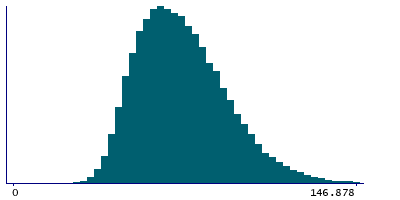
2 Instances
Instance 2 : Imaging visit (2014+)
68,015 participants, 68,015 items
| Maximum | 214.013 |
| Decile 9 | 98.9169 |
| Decile 8 | 88.3471 |
| Decile 7 | 81.1335 |
| Decile 6 | 75.2627 |
| Median | 69.9891 |
| Decile 4 | 65.0987 |
| Decile 3 | 60.2366 |
| Decile 2 | 55.1824 |
| Decile 1 | 49.2072 |
| Minimum | 3.82502 |
|
|
- Mean = 72.4626
- Std.dev = 19.841
- 132 items above graph maximum of 148.627
|
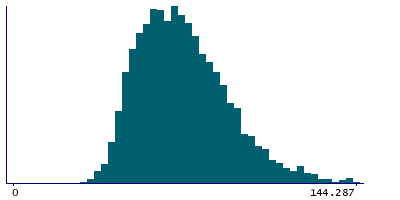
Instance 3 : First repeat imaging visit (2019+)
5,655 participants, 5,655 items
| Maximum | 215.466 |
| Decile 9 | 98.3138 |
| Decile 8 | 87.834 |
| Decile 7 | 80.9227 |
| Decile 6 | 74.7628 |
| Median | 69.593 |
| Decile 4 | 64.7959 |
| Decile 3 | 59.6646 |
| Decile 2 | 54.5545 |
| Decile 1 | 48.8398 |
| Minimum | 25.6706 |
|
|
- Mean = 72.1281
- Std.dev = 20.0006
- 15 items above graph maximum of 147.788
|