Data
74,451 items of data are available, covering 69,057 participants.
Defined-instances run from 2 to 3, labelled using Instancing
2.
Units of measurement are g/cm2.
| Maximum | 1.98787 |
| Decile 9 | 1.19448 |
| Decile 8 | 1.11955 |
| Decile 7 | 1.06589 |
| Decile 6 | 1.02038 |
| Median | 0.979017 |
| Decile 4 | 0.93807 |
| Decile 3 | 0.895329 |
| Decile 2 | 0.848396 |
| Decile 1 | 0.785937 |
| Minimum | 0 |
|

|
- Mean = 0.986033
- Std.dev = 0.159323
- 28 items above graph maximum of 1.60303
|
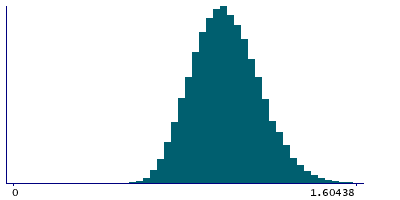
2 Instances
Instance 2 : Imaging visit (2014+)
68,703 participants, 68,703 items
| Maximum | 1.98787 |
| Decile 9 | 1.19519 |
| Decile 8 | 1.1201 |
| Decile 7 | 1.06619 |
| Decile 6 | 1.02043 |
| Median | 0.978978 |
| Decile 4 | 0.937982 |
| Decile 3 | 0.895391 |
| Decile 2 | 0.848406 |
| Decile 1 | 0.78602 |
| Minimum | 0 |
|
|
- Mean = 0.986208
- Std.dev = 0.159647
- 28 items above graph maximum of 1.60437
|
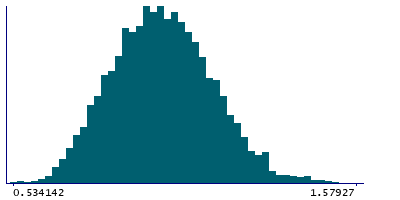
Instance 3 : First repeat imaging visit (2019+)
5,748 participants, 5,748 items
| Maximum | 1.59081 |
| Decile 9 | 1.18666 |
| Decile 8 | 1.11371 |
| Decile 7 | 1.06311 |
| Decile 6 | 1.01981 |
| Median | 0.979895 |
| Decile 4 | 0.939606 |
| Decile 3 | 0.893712 |
| Decile 2 | 0.848368 |
| Decile 1 | 0.784358 |
| Minimum | 0.49488 |
|
|
- Mean = 0.983943
- Std.dev = 0.155388
- 2 items above graph maximum of 1.58896
|