Data
37,044 items of data are available, covering 35,497 participants.
Defined-instances run from 2 to 3, labelled using Instancing
2.
Units of measurement are g/cm2.
| Maximum | 1.75967 |
| Decile 9 | 0.950877 |
| Decile 8 | 0.87492 |
| Decile 7 | 0.822614 |
| Decile 6 | 0.78009 |
| Median | 0.741988 |
| Decile 4 | 0.705959 |
| Decile 3 | 0.669962 |
| Decile 2 | 0.631934 |
| Decile 1 | 0.583735 |
| Minimum | 0 |
|
|
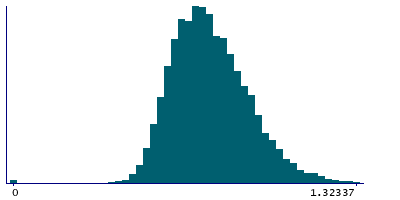
- Mean = 0.757192
- Std.dev = 0.147344
- 67 items above graph maximum of 1.31802
|
2 Instances
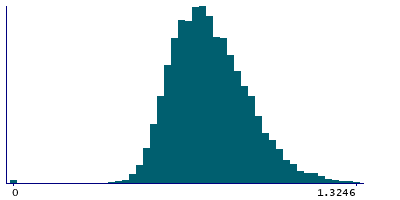
Instance 2 : Imaging visit (2014+)
34,934 participants, 34,934 items
| Maximum | 1.75967 |
| Decile 9 | 0.951937 |
| Decile 8 | 0.875137 |
| Decile 7 | 0.823031 |
| Decile 6 | 0.78034 |
| Median | 0.742289 |
| Decile 4 | 0.705959 |
| Decile 3 | 0.669718 |
| Decile 2 | 0.631798 |
| Decile 1 | 0.583531 |
| Minimum | 0 |
|
|
- Mean = 0.757369
- Std.dev = 0.147696
- 62 items above graph maximum of 1.32034
|
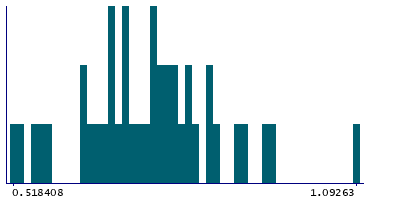
Instance 3 : First repeat imaging visit (2019+)
2,110 participants, 2,110 items
| Maximum | 1.44483 |
| Decile 9 | 0.93279 |
| Decile 8 | 0.867837 |
| Decile 7 | 0.817918 |
| Decile 6 | 0.776662 |
| Median | 0.736832 |
| Decile 4 | 0.706088 |
| Decile 3 | 0.672928 |
| Decile 2 | 0.633603 |
| Decile 1 | 0.585875 |
| Minimum | 0.24721 |
|
|
- Mean = 0.754266
- Std.dev = 0.141346
- 6 items above graph maximum of 1.2797
|