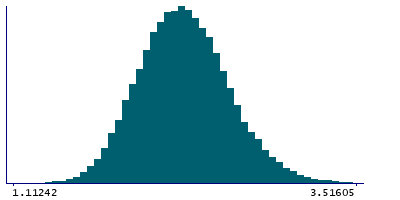
Data
78,765 items of data are available, covering 72,674 participants.
Defined-instances run from 2 to 3, labelled using Instancing
2.
Units of measurement are g/cm2.
| Maximum | 4.75251 |
| Decile 9 | 2.7164 |
| Decile 8 | 2.56556 |
| Decile 7 | 2.46238 |
| Decile 6 | 2.37474 |
| Median | 2.29378 |
| Decile 4 | 2.21345 |
| Decile 3 | 2.13075 |
| Decile 2 | 2.0351 |
| Decile 1 | 1.90745 |
| Minimum | 0 |
|
|
- Mean = 2.30545
- Std.dev = 0.318503
- 5 items below graph minimum of 1.09851
- 35 items above graph maximum of 3.52534
|
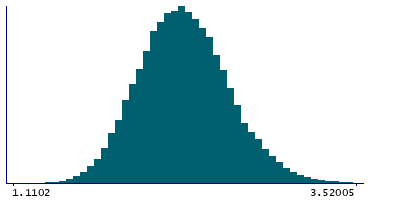
2 Instances
Instance 2 : Imaging visit (2014+)
72,404 participants, 72,404 items
| Maximum | 4.75251 |
| Decile 9 | 2.71734 |
| Decile 8 | 2.5669 |
| Decile 7 | 2.46344 |
| Decile 6 | 2.37558 |
| Median | 2.29403 |
| Decile 4 | 2.21382 |
| Decile 3 | 2.13064 |
| Decile 2 | 2.03511 |
| Decile 1 | 1.90729 |
| Minimum | 0 |
|
|
- Mean = 2.30586
- Std.dev = 0.319074
- 4 items below graph minimum of 1.09723
- 33 items above graph maximum of 3.5274
|
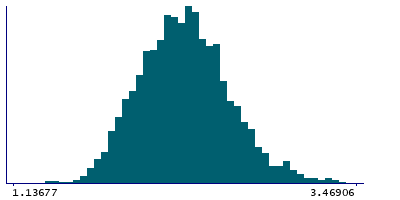
Instance 3 : First repeat imaging visit (2019+)
6,361 participants, 6,361 items
| Maximum | 3.64969 |
| Decile 9 | 2.70701 |
| Decile 8 | 2.54939 |
| Decile 7 | 2.45153 |
| Decile 6 | 2.36454 |
| Median | 2.29165 |
| Decile 4 | 2.21071 |
| Decile 3 | 2.13273 |
| Decile 2 | 2.03496 |
| Decile 1 | 1.91037 |
| Minimum | 0 |
|
|
- Mean = 2.30087
- Std.dev = 0.311898
- 1 item below graph minimum of 1.11374
- 2 items above graph maximum of 3.50364
|