Data
39,618 items of data are available, covering 37,214 participants.
Defined-instances run from 2 to 3, labelled using Instancing
2.
Units of measurement are g/cm2.
| Maximum | 2.50861 |
| Decile 9 | 1.19253 |
| Decile 8 | 1.12111 |
| Decile 7 | 1.06863 |
| Decile 6 | 1.02411 |
| Median | 0.981801 |
| Decile 4 | 0.941248 |
| Decile 3 | 0.897673 |
| Decile 2 | 0.850368 |
| Decile 1 | 0.792216 |
| Minimum | 0.470742 |
|
|
- Mean = 0.98871
- Std.dev = 0.155216
- 14 items above graph maximum of 1.59285
|
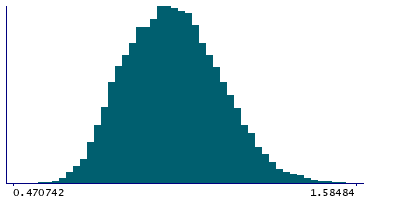
2 Instances
Instance 2 : Imaging visit (2014+)
35,837 participants, 35,837 items
| Maximum | 2.50861 |
| Decile 9 | 1.19281 |
| Decile 8 | 1.12152 |
| Decile 7 | 1.069 |
| Decile 6 | 1.02442 |
| Median | 0.982228 |
| Decile 4 | 0.941617 |
| Decile 3 | 0.898046 |
| Decile 2 | 0.850691 |
| Decile 1 | 0.792394 |
| Minimum | 0.470742 |
|

|
- Mean = 0.989109
- Std.dev = 0.155196
- 12 items above graph maximum of 1.59322
|
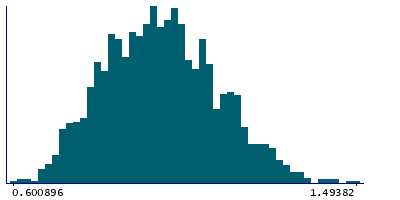
Instance 3 : First repeat imaging visit (2019+)
3,781 participants, 3,781 items
| Maximum | 1.60983 |
| Decile 9 | 1.18903 |
| Decile 8 | 1.11677 |
| Decile 7 | 1.06469 |
| Decile 6 | 1.02046 |
| Median | 0.977667 |
| Decile 4 | 0.937788 |
| Decile 3 | 0.891627 |
| Decile 2 | 0.846179 |
| Decile 1 | 0.789123 |
| Minimum | 0.560674 |
|
|
- Mean = 0.984927
- Std.dev = 0.155356
- 2 items above graph maximum of 1.58894
|