Data
78,765 items of data are available, covering 72,674 participants.
Defined-instances run from 2 to 3, labelled using Instancing
2.
| Maximum | 791.577 |
| Decile 9 | 440.271 |
| Decile 8 | 397.441 |
| Decile 7 | 366.504 |
| Decile 6 | 340.574 |
| Median | 316.899 |
| Decile 4 | 294.811 |
| Decile 3 | 274.114 |
| Decile 2 | 253.184 |
| Decile 1 | 228.58 |
| Minimum | 0 |
|

|
- Mean = 327.056
- Std.dev = 82.8443
- 50 items above graph maximum of 651.963
|
2 Instances
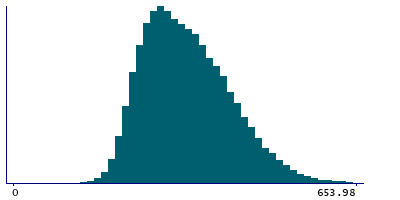
Instance 2 : Imaging visit (2014+)
72,404 participants, 72,404 items
| Maximum | 791.577 |
| Decile 9 | 440.287 |
| Decile 8 | 397.541 |
| Decile 7 | 366.484 |
| Decile 6 | 340.561 |
| Median | 316.894 |
| Decile 4 | 294.757 |
| Decile 3 | 274.086 |
| Decile 2 | 253.295 |
| Decile 1 | 228.556 |
| Minimum | 0 |
|
|
- Mean = 327.067
- Std.dev = 82.8726
- 44 items above graph maximum of 652.018
|
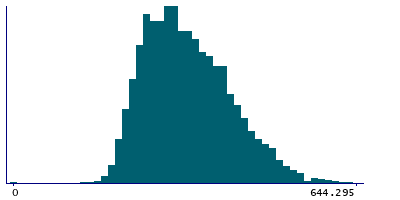
Instance 3 : First repeat imaging visit (2019+)
6,361 participants, 6,361 items
| Maximum | 694.474 |
| Decile 9 | 440.141 |
| Decile 8 | 395.996 |
| Decile 7 | 366.927 |
| Decile 6 | 340.665 |
| Median | 316.965 |
| Decile 4 | 295.32 |
| Decile 3 | 274.197 |
| Decile 2 | 252.221 |
| Decile 1 | 228.938 |
| Minimum | 0 |
|
|
- Mean = 326.925
- Std.dev = 82.5217
- 6 items above graph maximum of 651.344
|