Data
39,618 items of data are available, covering 37,214 participants.
Defined-instances run from 2 to 3, labelled using Instancing
2.
Units of measurement are cm2.
| Maximum | 333.501 |
| Decile 9 | 236.764 |
| Decile 8 | 223.529 |
| Decile 7 | 212.934 |
| Decile 6 | 202.797 |
| Median | 191.938 |
| Decile 4 | 182.096 |
| Decile 3 | 173.424 |
| Decile 2 | 165.332 |
| Decile 1 | 155.9 |
| Minimum | 20.0176 |
|
|
- Mean = 194.635
- Std.dev = 31.3556
- 4 items above graph maximum of 317.628
|
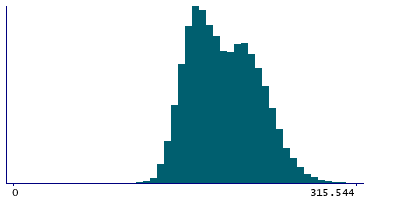
2 Instances
Instance 2 : Imaging visit (2014+)
35,837 participants, 35,837 items
| Maximum | 330.568 |
| Decile 9 | 236.491 |
| Decile 8 | 223.248 |
| Decile 7 | 212.68 |
| Decile 6 | 202.54 |
| Median | 191.669 |
| Decile 4 | 181.853 |
| Decile 3 | 173.278 |
| Decile 2 | 165.232 |
| Decile 1 | 155.825 |
| Minimum | 20.0176 |
|

|
- Mean = 194.408
- Std.dev = 31.2872
- 2 items above graph maximum of 317.156
|
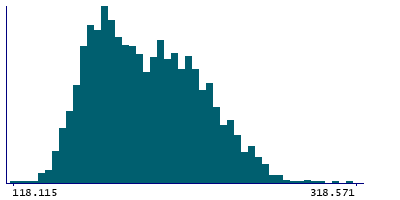
Instance 3 : First repeat imaging visit (2019+)
3,781 participants, 3,781 items
| Maximum | 333.501 |
| Decile 9 | 239.813 |
| Decile 8 | 225.915 |
| Decile 7 | 215.217 |
| Decile 6 | 205.704 |
| Median | 194.521 |
| Decile 4 | 184.404 |
| Decile 3 | 175.441 |
| Decile 2 | 166.644 |
| Decile 1 | 156.697 |
| Minimum | 110.348 |
|
|
- Mean = 196.786
- Std.dev = 31.9163
- 2 items above graph maximum of 322.93
|