Data
507,960 items of data are available, covering 488,512 participants.
Defined-instances run from 0 to 1, labelled using Instancing
2.
Units of measurement are mmol/l.
| Maximum | 6.21493 |
| Decile 9 | 2.35917 |
| Decile 8 | 2.13823 |
| Decile 7 | 1.9887 |
| Decile 6 | 1.86371 |
| Median | 1.75092 |
| Decile 4 | 1.6418 |
| Decile 3 | 1.5277 |
| Decile 2 | 1.3984 |
| Decile 1 | 1.22695 |
| Minimum | 7.08028e-14 |
|
|
- Mean = 1.77722
- Std.dev = 0.449224
- 561 items above graph maximum of 3.49138
|
2 Instances
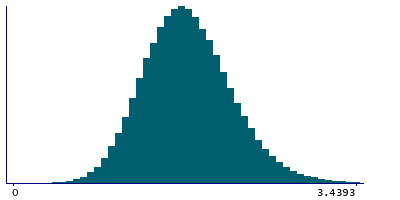
Instance 0 : Initial assessment visit (2006-2010) at which participants were recruited and consent given
488,083 participants, 488,083 items
| Maximum | 6.21493 |
| Decile 9 | 2.3604 |
| Decile 8 | 2.1394 |
| Decile 7 | 1.99 |
| Decile 6 | 1.86494 |
| Median | 1.75217 |
| Decile 4 | 1.6429 |
| Decile 3 | 1.5289 |
| Decile 2 | 1.3999 |
| Decile 1 | 1.22871 |
| Minimum | 7.08028e-14 |
|

|
- Mean = 1.77849
- Std.dev = 0.449101
- 532 items above graph maximum of 3.49209
|
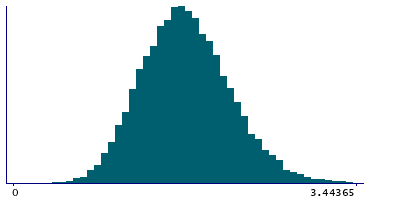
Instance 1 : First repeat assessment visit (2012-13)
19,877 participants, 19,877 items
| Maximum | 4.40252 |
| Decile 9 | 2.32335 |
| Decile 8 | 2.10886 |
| Decile 7 | 1.95925 |
| Decile 6 | 1.83365 |
| Median | 1.72096 |
| Decile 4 | 1.61432 |
| Decile 3 | 1.4967 |
| Decile 2 | 1.3613 |
| Decile 1 | 1.1898 |
| Minimum | 0.1645 |
|
|
- Mean = 1.74601
- Std.dev = 0.451104
- 30 items above graph maximum of 3.4569
|


