Data
507,961 items of data are available, covering 488,513 participants.
Defined-instances run from 0 to 1, labelled using Instancing
2.
Units of measurement are mmol/l.
| Maximum | 9.27202 |
| Decile 9 | 2.16823 |
| Decile 8 | 1.8013 |
| Decile 7 | 1.5634 |
| Decile 6 | 1.3772 |
| Median | 1.2187 |
| Decile 4 | 1.0784 |
| Decile 3 | 0.949193 |
| Decile 2 | 0.82276 |
| Decile 1 | 0.68657 |
| Minimum | 0.17923 |
|

|
- Mean = 1.34542
- Std.dev = 0.616113
- 2393 items above graph maximum of 3.64989
|
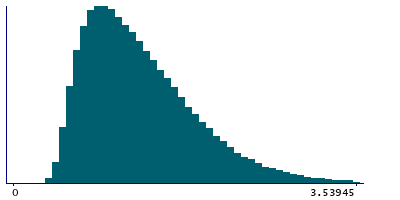
2 Instances
Instance 0 : Initial assessment visit (2006-2010) at which participants were recruited and consent given
488,084 participants, 488,084 items
| Maximum | 9.27202 |
| Decile 9 | 2.17243 |
| Decile 8 | 1.8042 |
| Decile 7 | 1.5654 |
| Decile 6 | 1.3784 |
| Median | 1.21949 |
| Decile 4 | 1.07848 |
| Decile 3 | 0.948733 |
| Decile 2 | 0.821975 |
| Decile 1 | 0.685763 |
| Minimum | 0.17923 |
|
|
- Mean = 1.34662
- Std.dev = 0.618104
- 2299 items above graph maximum of 3.6591
|
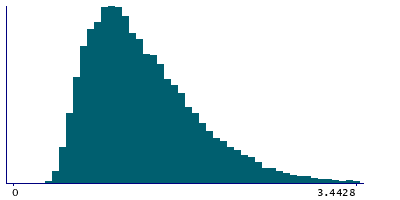
Instance 1 : First repeat assessment visit (2012-13)
19,877 participants, 19,877 items
| Maximum | 6.6435 |
| Decile 9 | 2.07085 |
| Decile 8 | 1.72978 |
| Decile 7 | 1.5181 |
| Decile 6 | 1.3505 |
| Median | 1.20275 |
| Decile 4 | 1.07735 |
| Decile 3 | 0.959788 |
| Decile 2 | 0.839103 |
| Decile 1 | 0.70614 |
| Minimum | 0.32192 |
|
|
- Mean = 1.31603
- Std.dev = 0.564244
- 92 items above graph maximum of 3.43556
|


