Data
507,960 items of data are available, covering 488,512 participants.
Defined-instances run from 0 to 1, labelled using Instancing
2.
Units of measurement are mmol/l.
| Maximum | 2.4742 |
| Decile 9 | 0.729772 |
| Decile 8 | 0.629454 |
| Decile 7 | 0.561267 |
| Decile 6 | 0.506017 |
| Median | 0.45721 |
| Decile 4 | 0.411759 |
| Decile 3 | 0.36667 |
| Decile 2 | 0.318619 |
| Decile 1 | 0.260498 |
| Minimum | 0.03719 |
|
|
- Mean = 0.480714
- Std.dev = 0.187124
- 1033 items above graph maximum of 1.19905
|
2 Instances
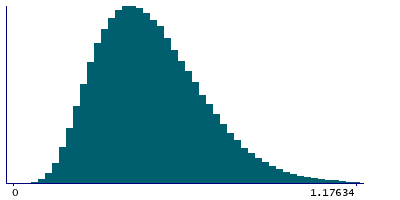
Instance 0 : Initial assessment visit (2006-2010) at which participants were recruited and consent given
488,083 participants, 488,083 items
| Maximum | 2.4742 |
| Decile 9 | 0.730687 |
| Decile 8 | 0.630278 |
| Decile 7 | 0.56198 |
| Decile 6 | 0.506585 |
| Median | 0.457569 |
| Decile 4 | 0.41203 |
| Decile 3 | 0.36677 |
| Decile 2 | 0.318686 |
| Decile 1 | 0.26043 |
| Minimum | 0.03719 |
|

|
- Mean = 0.481185
- Std.dev = 0.187572
- 989 items above graph maximum of 1.20094
|
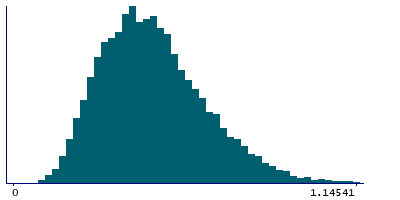
Instance 1 : First repeat assessment visit (2012-13)
19,877 participants, 19,877 items
| Maximum | 1.59001 |
| Decile 9 | 0.70303 |
| Decile 8 | 0.607965 |
| Decile 7 | 0.542875 |
| Decile 6 | 0.493386 |
| Median | 0.449345 |
| Decile 4 | 0.40553 |
| Decile 3 | 0.364475 |
| Decile 2 | 0.317085 |
| Decile 1 | 0.26216 |
| Minimum | 0.067021 |
|
|
- Mean = 0.469157
- Std.dev = 0.175367
- 33 items above graph maximum of 1.1439
|


