Data
507,960 items of data are available, covering 488,512 participants.
Defined-instances run from 0 to 1, labelled using Instancing
2.
Units of measurement are mmol/l.
| Maximum | 1.38179 |
| Decile 9 | 0.4428 |
| Decile 8 | 0.384267 |
| Decile 7 | 0.34436 |
| Decile 6 | 0.31176 |
| Median | 0.282981 |
| Decile 4 | 0.25579 |
| Decile 3 | 0.2286 |
| Decile 2 | 0.19949 |
| Decile 1 | 0.164049 |
| Minimum | 0.022736 |
|
|
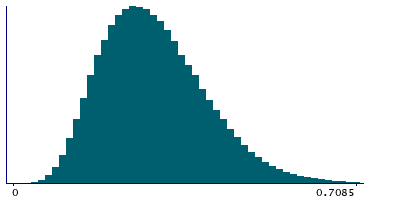
- Mean = 0.295517
- Std.dev = 0.110469
- 798 items above graph maximum of 0.721551
|
2 Instances
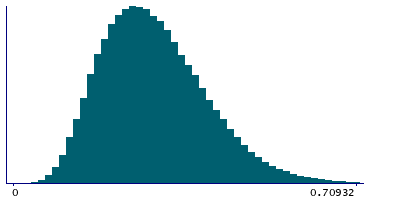
Instance 0 : Initial assessment visit (2006-2010) at which participants were recruited and consent given
488,083 participants, 488,083 items
| Maximum | 1.38179 |
| Decile 9 | 0.443369 |
| Decile 8 | 0.384739 |
| Decile 7 | 0.34482 |
| Decile 6 | 0.312056 |
| Median | 0.28319 |
| Decile 4 | 0.255932 |
| Decile 3 | 0.22867 |
| Decile 2 | 0.199554 |
| Decile 1 | 0.16403 |
| Minimum | 0.022736 |
|
|
- Mean = 0.295775
- Std.dev = 0.110691
- 775 items above graph maximum of 0.722708
|
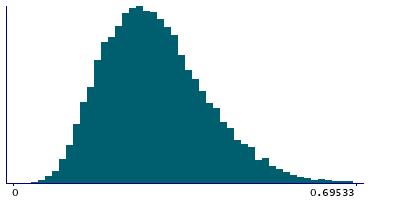
Instance 1 : First repeat assessment visit (2012-13)
19,877 participants, 19,877 items
| Maximum | 0.93174 |
| Decile 9 | 0.42999 |
| Decile 8 | 0.37289 |
| Decile 7 | 0.334571 |
| Decile 6 | 0.305035 |
| Median | 0.278325 |
| Decile 4 | 0.25249 |
| Decile 3 | 0.226595 |
| Decile 2 | 0.19817 |
| Decile 1 | 0.16448 |
| Minimum | 0.043046 |
|
|
- Mean = 0.289182
- Std.dev = 0.104648
- 23 items above graph maximum of 0.6955
|


