Data
507,960 items of data are available, covering 488,512 participants.
Defined-instances run from 0 to 1, labelled using Instancing
2.
Units of measurement are mmol/l.
| Maximum | 9.18322 |
| Decile 9 | 3.9498 |
| Decile 8 | 3.5897 |
| Decile 7 | 3.3477 |
| Decile 6 | 3.1564 |
| Median | 2.9881 |
| Decile 4 | 2.83 |
| Decile 3 | 2.67343 |
| Decile 2 | 2.50638 |
| Decile 1 | 2.296 |
| Minimum | 0.517351 |
|

|
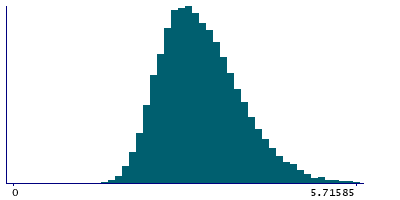
- Mean = 3.06821
- Std.dev = 0.660127
- 915 items above graph maximum of 5.6036
|
2 Instances
Instance 0 : Initial assessment visit (2006-2010) at which participants were recruited and consent given
488,083 participants, 488,083 items
| Maximum | 9.18322 |
| Decile 9 | 3.94543 |
| Decile 8 | 3.5855 |
| Decile 7 | 3.3434 |
| Decile 6 | 3.15279 |
| Median | 2.9849 |
| Decile 4 | 2.8271 |
| Decile 3 | 2.671 |
| Decile 2 | 2.504 |
| Decile 1 | 2.29388 |
| Minimum | 0.517351 |
|

|
- Mean = 3.06495
- Std.dev = 0.659224
- 878 items above graph maximum of 5.59698
|
Instance 1 : First repeat assessment visit (2012-13)
19,877 participants, 19,877 items
| Maximum | 8.179 |
| Decile 9 | 4.04901 |
| Decile 8 | 3.68865 |
| Decile 7 | 3.4489 |
| Decile 6 | 3.2495 |
| Median | 3.06925 |
| Decile 4 | 2.90405 |
| Decile 3 | 2.7367 |
| Decile 2 | 2.56825 |
| Decile 1 | 2.3506 |
| Minimum | 1.2977 |
|
|
- Mean = 3.14822
- Std.dev = 0.677028
- 36 items above graph maximum of 5.74742
|


