Data
507,960 items of data are available, covering 488,512 participants.
Defined-instances run from 0 to 1, labelled using Instancing
2.
Units of measurement are mmol/l.
| Maximum | 0.00384588 |
| Decile 9 | 0.00159562 |
| Decile 8 | 0.00144824 |
| Decile 7 | 0.0013484 |
| Decile 6 | 0.001267 |
| Median | 0.0011935 |
| Decile 4 | 0.001123 |
| Decile 3 | 0.0010507 |
| Decile 2 | 0.000970471 |
| Decile 1 | 0.00086552 |
| Minimum | 9.6977e-05 |
|

|
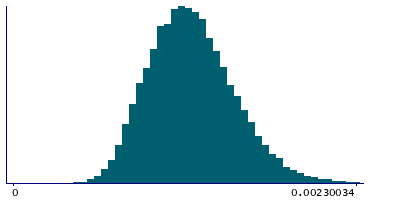
- Mean = 0.00121661
- Std.dev = 0.000289205
- 660 items above graph maximum of 0.00232572
|
2 Instances
Instance 0 : Initial assessment visit (2006-2010) at which participants were recruited and consent given
488,083 participants, 488,083 items
| Maximum | 0.00384588 |
| Decile 9 | 0.0015965 |
| Decile 8 | 0.00144889 |
| Decile 7 | 0.001349 |
| Decile 6 | 0.00126768 |
| Median | 0.0011941 |
| Decile 4 | 0.0011236 |
| Decile 3 | 0.0010513 |
| Decile 2 | 0.000971307 |
| Decile 1 | 0.00086637 |
| Minimum | 9.6977e-05 |
|

|
- Mean = 0.00121735
- Std.dev = 0.000289297
- 634 items above graph maximum of 0.00232664
|
Instance 1 : First repeat assessment visit (2012-13)
19,877 participants, 19,877 items
| Maximum | 0.0027751 |
| Decile 9 | 0.00157425 |
| Decile 8 | 0.00143035 |
| Decile 7 | 0.00133192 |
| Decile 6 | 0.0012511 |
| Median | 0.0011774 |
| Decile 4 | 0.00110772 |
| Decile 3 | 0.0010334 |
| Decile 2 | 0.000951365 |
| Decile 1 | 0.00084573 |
| Minimum | 0.00033218 |
|
|
- Mean = 0.00119821
- Std.dev = 0.000286318
- 25 items above graph maximum of 0.00230277
|


