Data
507,960 items of data are available, covering 488,512 participants.
Defined-instances run from 0 to 1, labelled using Instancing
2.
Units of measurement are mmol/l.
| Maximum | 0.0402566 |
| Decile 9 | 0.0187308 |
| Decile 8 | 0.017489 |
| Decile 7 | 0.01665 |
| Decile 6 | 0.015961 |
| Median | 0.0153466 |
| Decile 4 | 0.0147449 |
| Decile 3 | 0.0141239 |
| Decile 2 | 0.013419 |
| Decile 1 | 0.012481 |
| Minimum | 0.00196484 |
|

|
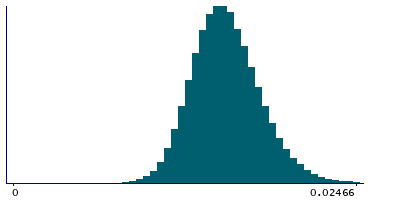
- Mean = 0.015507
- Std.dev = 0.00250991
- 889 items above graph maximum of 0.0249805
|
2 Instances
Instance 0 : Initial assessment visit (2006-2010) at which participants were recruited and consent given
488,083 participants, 488,083 items
| Maximum | 0.0402566 |
| Decile 9 | 0.018722 |
| Decile 8 | 0.01748 |
| Decile 7 | 0.016642 |
| Decile 6 | 0.0159533 |
| Median | 0.0153397 |
| Decile 4 | 0.014738 |
| Decile 3 | 0.014118 |
| Decile 2 | 0.0134147 |
| Decile 1 | 0.012476 |
| Minimum | 0.00196484 |
|
|
- Mean = 0.0155003
- Std.dev = 0.00250773
- 835 items above graph maximum of 0.024968
|
Instance 1 : First repeat assessment visit (2012-13)
19,877 participants, 19,877 items
| Maximum | 0.035686 |
| Decile 9 | 0.018912 |
| Decile 8 | 0.0176892 |
| Decile 7 | 0.016828 |
| Decile 6 | 0.016138 |
| Median | 0.015525 |
| Decile 4 | 0.01491 |
| Decile 3 | 0.014273 |
| Decile 2 | 0.013547 |
| Decile 1 | 0.0126095 |
| Minimum | 0.0059834 |
|

|
- Mean = 0.0156711
- Std.dev = 0.00255751
- 1 item below graph minimum of 0.006307
- 54 items above graph maximum of 0.0252145
|


