Data
507,960 items of data are available, covering 488,512 participants.
Defined-instances run from 0 to 1, labelled using Instancing
2.
Units of measurement are nm.
| Maximum | 45.149 |
| Decile 9 | 40.367 |
| Decile 8 | 39.8107 |
| Decile 7 | 39.378 |
| Decile 6 | 38.9952 |
| Median | 38.6369 |
| Decile 4 | 38.298 |
| Decile 3 | 37.959 |
| Decile 2 | 37.5846 |
| Decile 1 | 37.096 |
| Minimum | 33.49 |
|
|
- Mean = 38.6934
- Std.dev = 1.26664
- 6 items below graph minimum of 33.825
- 45 items above graph maximum of 43.638
|
2 Instances
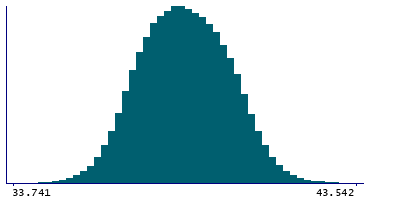
Instance 0 : Initial assessment visit (2006-2010) at which participants were recruited and consent given
488,083 participants, 488,083 items
| Maximum | 45.149 |
| Decile 9 | 40.3692 |
| Decile 8 | 39.8131 |
| Decile 7 | 39.38 |
| Decile 6 | 38.997 |
| Median | 38.638 |
| Decile 4 | 38.2995 |
| Decile 3 | 37.96 |
| Decile 2 | 37.586 |
| Decile 1 | 37.0971 |
| Minimum | 33.49 |
|

|
- Mean = 38.6952
- Std.dev = 1.26696
- 6 items below graph minimum of 33.825
- 42 items above graph maximum of 43.6413
|
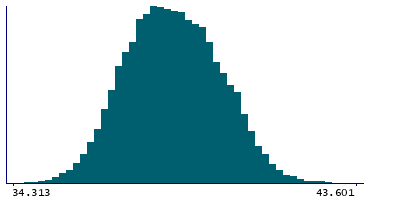
Instance 1 : First repeat assessment visit (2012-13)
19,877 participants, 19,877 items
| Maximum | 44.243 |
| Decile 9 | 40.321 |
| Decile 8 | 39.746 |
| Decile 7 | 39.328 |
| Decile 6 | 38.9545 |
| Median | 38.601 |
| Decile 4 | 38.262 |
| Decile 3 | 37.925 |
| Decile 2 | 37.551 |
| Decile 1 | 37.063 |
| Minimum | 34.313 |
|
|
- Mean = 38.6485
- Std.dev = 1.25787
- 5 items above graph maximum of 43.579
|


