Data
507,328 items of data are available, covering 487,914 participants.
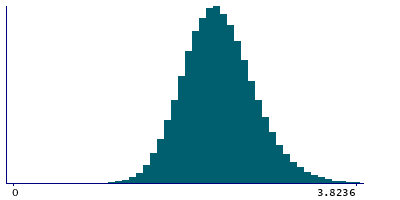
Defined-instances run from 0 to 1, labelled using Instancing
2.
Units of measurement are mmol/l.
| Maximum | 6.1124 |
| Decile 9 | 2.84993 |
| Decile 8 | 2.65419 |
| Decile 7 | 2.5195 |
| Decile 6 | 2.4089 |
| Median | 2.30754 |
| Decile 4 | 2.20896 |
| Decile 3 | 2.1055 |
| Decile 2 | 1.9878 |
| Decile 1 | 1.82857 |
| Minimum | 0.10943 |
|

|
- Mean = 2.32841
- Std.dev = 0.40852
- 786 items above graph maximum of 3.87129
|
2 Instances
Instance 0 : Initial assessment visit (2006-2010) at which participants were recruited and consent given
487,463 participants, 487,463 items
| Maximum | 6.1124 |
| Decile 9 | 2.84928 |
| Decile 8 | 2.65301 |
| Decile 7 | 2.5185 |
| Decile 6 | 2.40782 |
| Median | 2.3067 |
| Decile 4 | 2.20824 |
| Decile 3 | 2.1049 |
| Decile 2 | 1.9875 |
| Decile 1 | 1.8284 |
| Minimum | 0.10943 |
|
|
- Mean = 2.32772
- Std.dev = 0.408178
- 750 items above graph maximum of 3.87015
|
Instance 1 : First repeat assessment visit (2012-13)
19,865 participants, 19,865 items
| Maximum | 4.98114 |
| Decile 9 | 2.8653 |
| Decile 8 | 2.6811 |
| Decile 7 | 2.54695 |
| Decile 6 | 2.4335 |
| Median | 2.3313 |
| Decile 4 | 2.22639 |
| Decile 3 | 2.11967 |
| Decile 2 | 1.9957 |
| Decile 1 | 1.83139 |
| Minimum | 0.82296 |
|

|
- Mean = 2.34517
- Std.dev = 0.416454
- 36 items above graph maximum of 3.89921
|


