Data
507,328 items of data are available, covering 487,914 participants.
Defined-instances run from 0 to 1, labelled using Instancing
2.
Units of measurement are mmol/l.
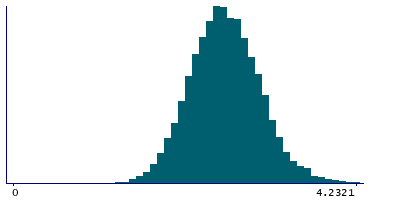
| Maximum | 6.2691 |
| Decile 9 | 3.1504 |
| Decile 8 | 2.95117 |
| Decile 7 | 2.81313 |
| Decile 6 | 2.69924 |
| Median | 2.59413 |
| Decile 4 | 2.4919 |
| Decile 3 | 2.3844 |
| Decile 2 | 2.2613 |
| Decile 1 | 2.09325 |
| Minimum | 0.34038 |
|

|
- Mean = 2.61268
- Std.dev = 0.421596
- 686 items above graph maximum of 4.20754
|
2 Instances
Instance 0 : Initial assessment visit (2006-2010) at which participants were recruited and consent given
487,463 participants, 487,463 items
| Maximum | 6.2691 |
| Decile 9 | 3.14964 |
| Decile 8 | 2.94999 |
| Decile 7 | 2.8121 |
| Decile 6 | 2.6982 |
| Median | 2.59341 |
| Decile 4 | 2.4913 |
| Decile 3 | 2.3841 |
| Decile 2 | 2.2613 |
| Decile 1 | 2.0935 |
| Minimum | 0.34038 |
|

|
- Mean = 2.61213
- Std.dev = 0.420997
- 652 items above graph maximum of 4.20578
|
Instance 1 : First repeat assessment visit (2012-13)
19,865 participants, 19,865 items
| Maximum | 5.48988 |
| Decile 9 | 3.17052 |
| Decile 8 | 2.9783 |
| Decile 7 | 2.8392 |
| Decile 6 | 2.7253 |
| Median | 2.61185 |
| Decile 4 | 2.5065 |
| Decile 3 | 2.3924 |
| Decile 2 | 2.26034 |
| Decile 1 | 2.0864 |
| Minimum | 1.0062 |
|
|
- Mean = 2.62613
- Std.dev = 0.435815
- 34 items above graph maximum of 4.25463
|


